Occupational Therapist Salary in Moline, IL: $91,661 (2026)
Quick Answer:A full-time occupational therapist in Moline, IL earns a median $91,661/year (≈ $44.07/hour) in nominal terms for 2026 — projected from BLS OEWS 2025 (SOC 29-1122). Once you factor in Moline's price level (3% below national, BEA RPP 97.1), that paycheck buys what $94,399 would nationally. Nominal pay sits 7.9% below the Illinois state average.
Based on BLS state-level estimates · View source
Occupational therapists in Moline, Illinois, can expect a median annual salary of $91,661 in 2026, which reflects local estimates based on 2025 BLS data and regional price adjustments. The salary for this profession varies significantly, ranging from $66,378 at the 10th percentile to $113,567 at the 90th percentile. While this pay scale indicates a healthy compensation range, it remains 11.35% lower than the national median of $103,400. Notably, these projections arrive during a time when Medicare cuts have impacted compensation models for skilled nursing facilities and outpatient settings, signaling potential shifts in salary dynamics for OTs in the area. The employment landscape currently shows 10 occupational therapists working locally, revealing both opportunities and challenges in the job market.
About the Moline Market
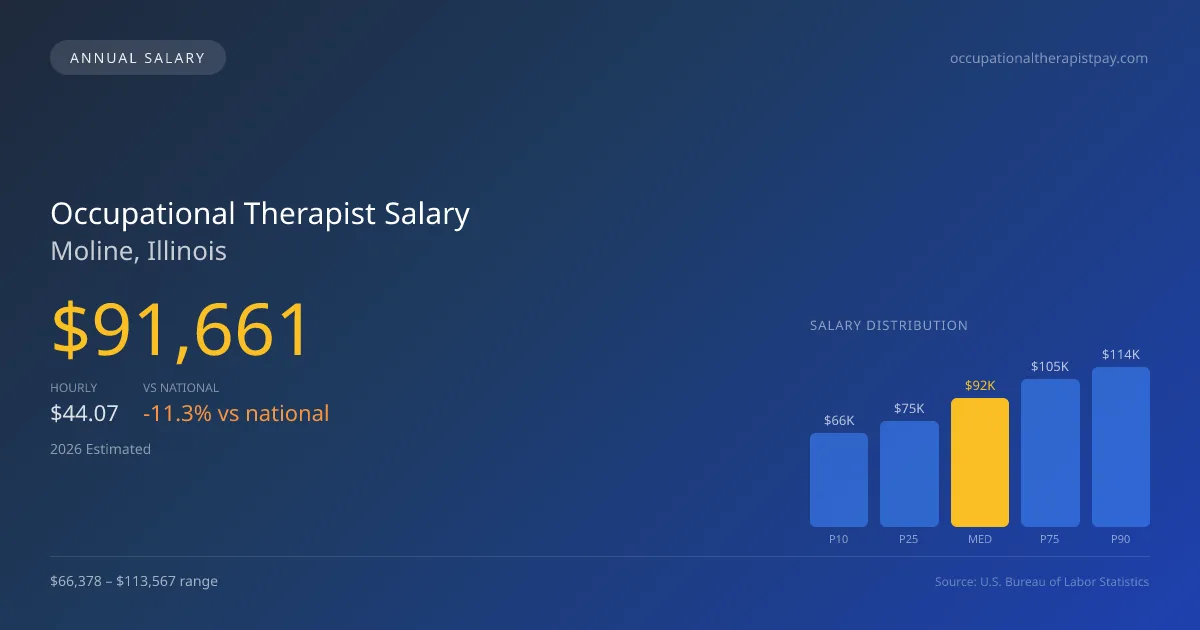
Salary estimated from Illinois average ($92,000) adjusted for local cost of living.
Salary Breakdown
| Percentile | Annual | Hourly |
|---|---|---|
| Entry Level (P10) | $66,378 | $31.91 |
| Lower Range (P25) | $75,282 | $36.19 |
| Median (P50)(typical) | $91,661 | $44.07 |
| Upper Range (P75) | $105,303 | $50.62 |
| Top Earners (P90) | $113,567 | $54.60 |
Median Salary Position
11.35% below the national average
2026 Salary Percentile Distribution in Moline
In Moline, IL, the occupational therapist salary spread from the 10th to 90th percentile is $47,189 (2026 est.). At $91,661, the local median is 11.35% below the national median of $103,400.
Salary Calculator
At 40 hours/week in Moline: You'd be above the median
How Moline Occupational Therapist Pay Compares
Moline median: $91,661/year (2026)
| Compared To | Median Salary | Moline Pays |
|---|---|---|
| Illinois Average | $99,523 | -7.90% less |
| National Average | $103,400 | -11.35% less |
Occupational Therapists in Moline, IL earn a median of $91,661 per year (2026 est.), which is 11.35% lower than the national median of $103,400 and 7.90% below the Illinois state average of $99,523.
Cost-of-Living Adjusted Salary
Moline has a cost of living 2.90% below the national average, meaning your salary goes further here.
Adjusted salary = nominal × (100 / CoL index). CoL index: 100 = national average.
Moline, IL has a cost-of-living index of 97.1 (below the national average of 100). A occupational therapist earning $91,661 nominally has purchasing power equivalent to $94,399 in an average-cost city — an effective 2.99% boost.
Compare Purchasing Power
Select a city to see how your salary compares after cost of living
Select a city above to compare purchasing power
2019 BLS Actual
$75,305
2025 BLS Actual
$88,939
2026 Current Est.
$91,661
2019–2027 Growth
+25.4%
Salary Trajectory for Occupational Therapists in Moline (2019–2027)
2019–2025: actual BLS OEWS data for this metro area. 2026+: CAGR 3.06% projection.
| Year | Annual Salary | Status |
|---|---|---|
| 2019 | $75,305 | Actual |
| 2020 | $76,484 | Actual |
| 2021 | $75,855 | Actual |
| 2022 | $82,601 | Actual |
| 2023 | $85,429 | Actual |
| 2024 | $88,188 | Actual |
| 2025 | $88,939 | Actual |
| 2026(current) | $91,661 | Estimated |
| 2027 | $94,465 | Projected |
Based on 7 years of BLS OEWS data for the Moline metropolitan area, the median occupational therapist salary grew 18.1% from $75,305 (2019) to $88,939 (2025). At a 3.06% compound annual growth rate, salaries are projected to reach $94,465 by 2027 — a total increase of $19,160 (25.44%) from 2019.
Note: Historical values (2019–2025) are actual BLS OEWS figures for the Moline metropolitan area, sourced from annual Occupational Employment and Wage Statistics surveys. 2026–2026 figures are current estimates, and 2027 values are projections, calculated using a 3.06% CAGR derived from 7-year BLS historical data. Actual salaries may vary based on employer, experience, certifications, and local market conditions.
Salary by Experience Level
| Experience | Estimated Salary Range |
|---|---|
| 0-2 years (New Graduate) | $66,378 – $75,282 |
| 3-5 years (Mid Career) | $75,282 – $91,661 |
| 5+ years (Experienced) | $91,661 – $105,303 |
| 10+ years (Top Earner) | $105,303 – $113,567 |
OT, OTR salary ranges estimated from BLS percentile data. Individual occupational therapist compensation varies by employer, certifications, and specialization.
Occupational Therapist Job Market in Moline
In evaluating the occupational therapist pay in Moline, IL, candidates must consider local cost-of-living factors as well. With a cost of living index of 97.1, Moline offers a relatively affordable environment, allowing for better purchasing power compared to many other regions. Among local employers, skilled nursing facilities and hospital inpatient rehab units typically offer the highest salaries, while school contract positions tend to pay less. Variations in pay often arise from the setting, with hospital roles generally yielding more than those in schools or outpatient clinics. Additional factors such as specialty certifications like the CHT, productivity expectations, and the nature of school year contracts can drive wage disparities. For those aiming to maximize their occupational therapist salary in Moline, focusing on obtaining relevant certifications and pursuing roles in higher-paying industries can be advantageous, especially amidst evolving reimbursement models from Medicare cuts.
More salary data for Moline, IL:
Frequently Asked Questions
How much do occupational therapists make in Moline, IL in 2026?
Is Moline, IL a good place to work as a occupational therapist?
Can occupational therapists make $100K in Moline?
What is the cost-of-living adjusted occupational therapist salary in Moline?
How much does a occupational therapist make per hour in Moline?
Related Pages
Compare Salaries
Career Resources
Nearby Cities in Illinois
Written by Jordan Miller, OTR/L
Career Analyst
Jordan has 10 years of experience in occupational therapy. They specialize in pediatrics and work in a rehabilitation clinic.
Methodology & Data Source
Salary figures on this page are 2026 projections based on the Bureau of Labor Statistics Occupational Employment and Wage Statistics (OEWS) survey, May 2026 release. The BLS reported a median annual salary of $88,939 for occupational therapistsin the Moline metropolitan area. A 3.06% compound annual growth rate (CAGR), calculated from 6-year national BLS wage trends, was applied to project current 2026 compensation. Percentile ranges (P10–P90) represent the full salary distribution across experience levels and practice settings in this market.
Data Sources & Methodology
Salary data for Moline is estimated from official BLS state-level occupational wage data (2025), adjusted for regional cost-of-living differences using BEA RPP (Regional Price Parities).
2026 figures are projected from 2025 BLS data using a compound annual growth rate (CAGR) of 3.06%, derived from historical BLS wage trends for occupational therapists (SOC 29-1122).
Compiled and verified by Jordan Miller, OTR/L, a licensed occupational therapist with 10+ years of clinical experience. · View source data at BLS.gov