Occupational Therapist Salary in Rockford, IL: $99,577 (2026)
Quick Answer:A full-time occupational therapist in Rockford, IL earns a median $99,577/year (≈ $47.87/hour) in nominal terms for 2026 — projected from BLS OEWS 2025 (SOC 29-1122). Once you factor in Rockford's price level (8% below national, BEA RPP 92.2), that paycheck buys what $108,055 would nationally. Nominal pay sits 0.0% above the Illinois state average.
Official BLS data · View source
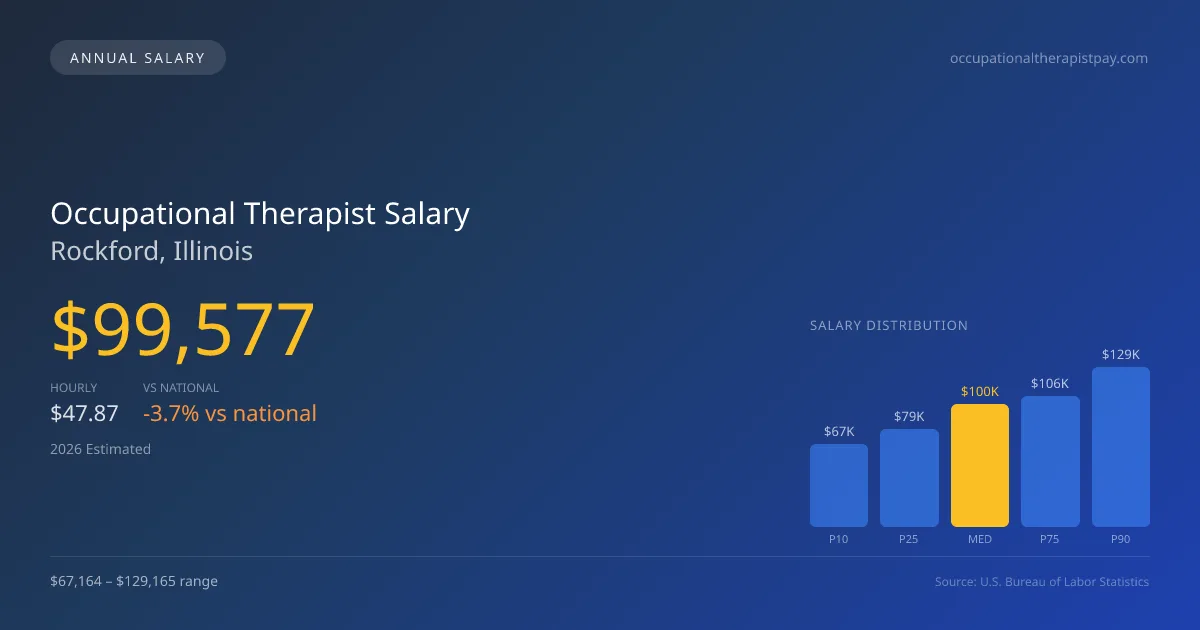
Occupational therapist salaries in Rockford, IL, project a 2026 median income of $99,577. This figure falls slightly below the national median of $103,400, reflecting a -3.70% variance. The salary range for the profession spans from $67,164 at the 10th percentile to $129,165 at the 90th percentile. These figures, derived from 2025 BLS OEWS data and projected to 2026, reveal the local market dynamics for therapists, especially highlighting how specialized credentials like the Certified Hand Therapist (CHT) can significantly enhance earning potential within this field. Given the area’s unique job market and the demand for high-quality therapy services, Rockford presents both challenges and rewards for occupational therapists pursuing careers here.
Salary Breakdown
| Percentile | Annual | Hourly |
|---|---|---|
| Entry Level (P10) | $67,164 | $32.29 |
| Lower Range (P25) | $79,418 | $38.18 |
| Median (P50)(typical) | $99,577 | $47.87 |
| Upper Range (P75) | $105,554 | $50.75 |
| Top Earners (P90) | $129,165 | $62.10 |
Median Salary Position
3.7% below the national average
2026 Salary Percentile Distribution in Rockford
In Rockford, IL, the occupational therapist salary spread from the 10th to 90th percentile is $62,001 (2026 est.). At $99,577, the local median is 3.7% below the national median of $103,400.
Salary Calculator
At 40 hours/week in Rockford: You'd be above the median
How Rockford Occupational Therapist Pay Compares
Rockford median: $99,577/year (2026)
| Compared To | Median Salary | Rockford Pays |
|---|---|---|
| National Average | $103,400 | -3.70% less |
Occupational Therapists in Rockford, IL earn a median of $99,577 per year (2026 est.), which is 3.70% lower than the national median of $103,400.
Cost-of-Living Adjusted Salary
Rockford has a cost of living 7.85% below the national average, meaning your salary goes further here.
Adjusted salary = nominal × (100 / CoL index). CoL index: 100 = national average.
Rockford, IL has a cost-of-living index of 92.154 (below the national average of 100). A occupational therapist earning $99,577 nominally has purchasing power equivalent to $108,055 in an average-cost city — an effective 8.51% boost.
Compare Purchasing Power
Select a city to see how your salary compares after cost of living
Select a city above to compare purchasing power
2019 BLS Actual
$85,130
2025 BLS Actual
$96,620
2026 Current Est.
$99,577
2019–2027 Growth
+20.5%
Salary Trajectory for Occupational Therapists in Rockford (2019–2027)
2019–2025: actual BLS OEWS data for this metro area. 2026+: CAGR 3.06% projection.
| Year | Annual Salary | Status |
|---|---|---|
| 2019 | $85,130 | Actual |
| 2020 | $92,440 | Actual |
| 2021 | $94,640 | Actual |
| 2022 | $95,110 | Actual |
| 2023 | $96,240 | Actual |
| 2024 | $100,070 | Actual |
| 2025 | $96,620 | Actual |
| 2026(current) | $99,577 | Estimated |
| 2027 | $102,624 | Projected |
Based on 7 years of BLS OEWS data for the Rockford metropolitan area, the median occupational therapist salary grew 13.5% from $85,130 (2019) to $96,620 (2025). At a 3.06% compound annual growth rate, salaries are projected to reach $102,624 by 2027 — a total increase of $17,494 (20.55%) from 2019.
Note: Historical values (2019–2025) are actual BLS OEWS figures for the Rockford metropolitan area, sourced from annual Occupational Employment and Wage Statistics surveys. 2026–2026 figures are current estimates, and 2027 values are projections, calculated using a 3.06% CAGR derived from 7-year BLS historical data. Actual salaries may vary based on employer, experience, certifications, and local market conditions.
Salary by Experience Level
| Experience | Estimated Salary Range |
|---|---|
| 0-2 years (New Graduate) | $67,164 – $79,418 |
| 3-5 years (Mid Career) | $79,418 – $99,577 |
| 5+ years (Experienced) | $99,577 – $105,554 |
| 10+ years (Top Earner) | $105,554 – $129,165 |
OT, OTR salary ranges estimated from BLS percentile data. Individual occupational therapist compensation varies by employer, certifications, and specialization.
Occupational Therapist Job Market in Rockford
In Rockford, approximately 130 occupational therapists are employed, illustrating a steady demand for skilled professionals in the field. The cost of living index stands at 92.154, indicating that living expenses are lower than the national average, which positively impacts the purchasing power of salaries received. Among employers, skilled nursing facilities generally offer some of the highest compensation, followed closely by hospital inpatient rehabilitation centers. Factors contributing to salary disparities include the work setting—therapists in hospitals tend to earn higher pay compared to those in educational institutions or skilled nursing facilities. The CHT designation can also translate into higher wages, while contracts for school-based therapists may offer annual terms that align with the academic calendar. For those looking to maximize their pay in Rockford, seeking employment in settings that value specialty certifications or offering year-round contracts could be effective strategies.
More salary data for Rockford, IL:
Frequently Asked Questions
How much do occupational therapists make in Rockford, IL in 2026?
Is Rockford, IL a good place to work as a occupational therapist?
Can occupational therapists make $100K in Rockford?
What is the cost-of-living adjusted occupational therapist salary in Rockford?
How much does a occupational therapist make per hour in Rockford?
Related Pages
Compare Salaries
Career Resources
Nearby Cities in Illinois
Written by Jordan Miller, OTR/L
Career Analyst
Jordan has 10 years of experience in occupational therapy. They specialize in pediatrics and work in a rehabilitation clinic.
Methodology & Data Source
Salary figures on this page are 2026 projections based on the Bureau of Labor Statistics Occupational Employment and Wage Statistics (OEWS) survey, May 2026 release. The BLS reported a median annual salary of $96,620 for occupational therapistsin the Rockford metropolitan area. A 3.06% compound annual growth rate (CAGR), calculated from 6-year national BLS wage trends, was applied to project current 2026 compensation. Percentile ranges (P10–P90) represent the full salary distribution across experience levels and practice settings in this market.
Data Sources & Methodology
Source: BLS, OEWS, 7-year dataset (–). Per-city data from annual BLS metropolitan area surveys.
2026 figures are projected from 2025 BLS data using a compound annual growth rate (CAGR) of 3.06%, derived from historical BLS wage trends for occupational therapists (SOC 29-1122).
Compiled and verified by Jordan Miller, OTR/L, a licensed occupational therapist with 10+ years of clinical experience. · View source data at BLS.gov