Occupational Therapist Salary in Aurora, IL: $98,332 (2026)
Quick Answer:A full-time occupational therapist in Aurora, IL earns a median $98,332/year (≈ $47.27/hour) in nominal terms for 2026 — projected from BLS OEWS 2025 (SOC 29-1122). Once you factor in Aurora's price level (3% below national, BEA RPP 97.1), that paycheck buys what $101,269 would nationally. Nominal pay sits 1.3% below the Illinois state average.
Based on BLS state-level estimates · View source
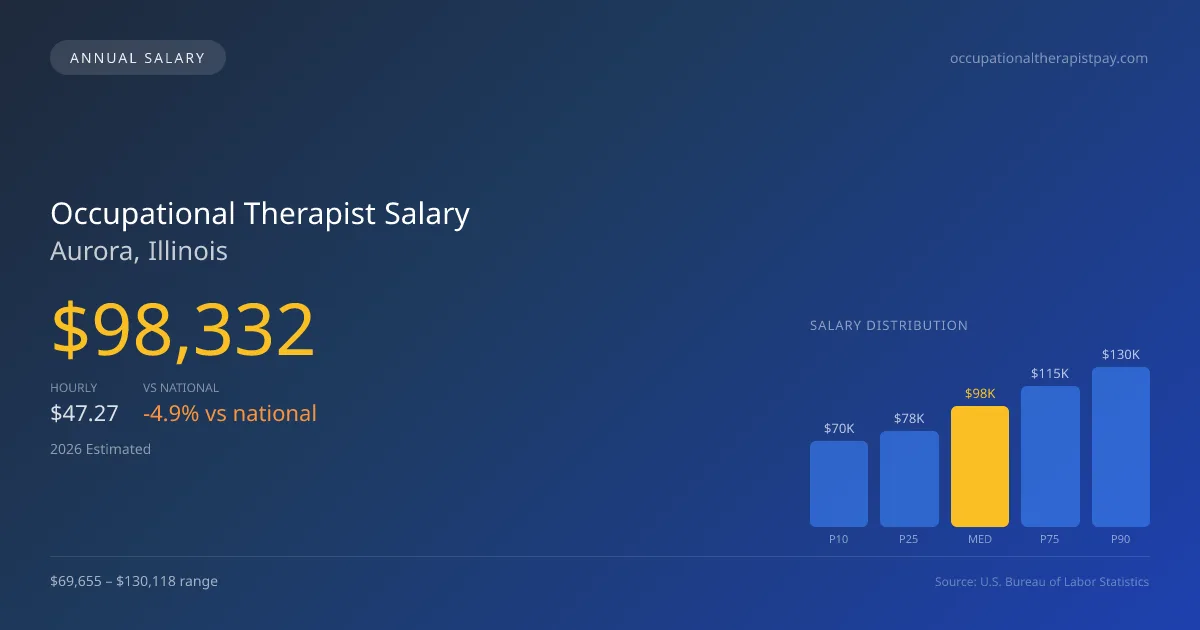
Occupational therapists in Aurora, Illinois can expect a median annual salary of $98,332 in 2026, reflecting local estimates based on 2025 BLS data adjusted for regional price levels. The salary range for this profession spans from $69,655 at the 10th percentile to $130,118 at the 90th percentile. These figures highlight the potential for career advancement and specialization, especially for those who achieve the Certified Hand Therapist (CHT) certification, which often commands a significant premium. As Aurora continues to foster growth in healthcare services, occupational therapists here can anticipate opportunities for higher paying positions and varied practice settings.
About the Aurora Market
Salary estimated from Illinois average ($92,000) adjusted for local cost of living.
Salary Breakdown
| Percentile | Annual | Hourly |
|---|---|---|
| Entry Level (P10) | $69,655 | $33.48 |
| Lower Range (P25) | $77,794 | $37.40 |
| Median (P50)(typical) | $98,332 | $47.27 |
| Upper Range (P75) | $114,859 | $55.22 |
| Top Earners (P90) | $130,118 | $62.56 |
Median Salary Position
4.9% below the national average
2026 Salary Percentile Distribution in Aurora
In Aurora, IL, the occupational therapist salary spread from the 10th to 90th percentile is $60,463 (2026 est.). At $98,332, the local median is 4.9% below the national median of $103,400.
Salary Calculator
At 40 hours/week in Aurora: You'd be in the lower-middle range
How Aurora Occupational Therapist Pay Compares
Aurora median: $98,332/year (2026)
| Compared To | Median Salary | Aurora Pays |
|---|---|---|
| Illinois Average | $99,627 | -1.30% less |
| National Average | $103,400 | -4.90% less |
Occupational Therapists in Aurora, IL earn a median of $98,332 per year (2026 est.), which is 4.90% lower than the national median of $103,400 and 1.30% below the Illinois state average of $99,627.
Cost-of-Living Adjusted Salary
Aurora has a cost of living 2.90% below the national average, meaning your salary goes further here.
Adjusted salary = nominal × (100 / CoL index). CoL index: 100 = national average.
Aurora, IL has a cost-of-living index of 97.1 (below the national average of 100). A occupational therapist earning $98,332 nominally has purchasing power equivalent to $101,269 in an average-cost city — an effective 2.99% boost.
Compare Purchasing Power
Select a city to see how your salary compares after cost of living
Select a city above to compare purchasing power
2019 BLS Actual
$80,786
2025 BLS Actual
$95,412
2026 Current Est.
$98,332
2019–2027 Growth
+25.4%
Salary Trajectory for Occupational Therapists in Aurora (2019–2027)
2019–2025: actual BLS OEWS data for this metro area. 2026+: CAGR 3.06% projection.
| Year | Annual Salary | Status |
|---|---|---|
| 2019 | $80,786 | Actual |
| 2020 | $82,051 | Actual |
| 2021 | $81,376 | Actual |
| 2022 | $88,612 | Actual |
| 2023 | $91,646 | Actual |
| 2024 | $88,215 | Actual |
| 2025 | $95,412 | Actual |
| 2026(current) | $98,332 | Estimated |
| 2027 | $101,341 | Projected |
Based on 7 years of BLS OEWS data for the Aurora metropolitan area, the median occupational therapist salary grew 18.1% from $80,786 (2019) to $95,412 (2025). At a 3.06% compound annual growth rate, salaries are projected to reach $101,341 by 2027 — a total increase of $20,555 (25.44%) from 2019.
Note: Historical values (2019–2025) are actual BLS OEWS figures for the Aurora metropolitan area, sourced from annual Occupational Employment and Wage Statistics surveys. 2026–2026 figures are current estimates, and 2027 values are projections, calculated using a 3.06% CAGR derived from 7-year BLS historical data. Actual salaries may vary based on employer, experience, certifications, and local market conditions.
Salary by Experience Level
| Experience | Estimated Salary Range |
|---|---|
| 0-2 years (New Graduate) | $69,655 – $77,794 |
| 3-5 years (Mid Career) | $77,794 – $98,332 |
| 5+ years (Experienced) | $98,332 – $114,859 |
| 10+ years (Top Earner) | $114,859 – $130,118 |
OT, OTR salary ranges estimated from BLS percentile data. Individual occupational therapist compensation varies by employer, certifications, and specialization.
Occupational Therapist Job Market in Aurora
The job market in Aurora for occupational therapists is solid, with 44 professionals currently employed in the area. The local cost-of-living index stands at 97.1, which is below the national average of 100. This lower index means that occupational therapist pay in Aurora, IL can stretch further in terms of real purchasing power compared to other regions. Among employers, skilled nursing facilities and hospital inpatient rehabilitation settings typically offer the most competitive salaries, while outpatient clinics and school contracts often come with lower compensation. Variations in pay can arise from factors such as practice setting, the impact of Medicare cuts on skilled nursing and outpatient services, and differences in productivity expectations. To maximize earnings potential in Aurora, therapists should consider pursuing the CHT certification, remain flexible in their role preferences, and explore positions in higher-paying healthcare environments.
More salary data for Aurora, IL:
Frequently Asked Questions
How much do occupational therapists make in Aurora, IL in 2026?
Is Aurora, IL a good place to work as a occupational therapist?
Can occupational therapists make $100K in Aurora?
What is the cost-of-living adjusted occupational therapist salary in Aurora?
How much does a occupational therapist make per hour in Aurora?
Related Pages
Compare Salaries
Career Resources
Nearby Cities in Illinois
Written by Jordan Miller, OTR/L
Career Analyst
Jordan has 10 years of experience in occupational therapy. They specialize in pediatrics and work in a rehabilitation clinic.
Methodology & Data Source
Salary figures on this page are 2026 projections based on the Bureau of Labor Statistics Occupational Employment and Wage Statistics (OEWS) survey, May 2026 release. The BLS reported a median annual salary of $95,412 for occupational therapistsin the Aurora metropolitan area. A 3.06% compound annual growth rate (CAGR), calculated from 6-year national BLS wage trends, was applied to project current 2026 compensation. Percentile ranges (P10–P90) represent the full salary distribution across experience levels and practice settings in this market.
Data Sources & Methodology
Salary data for Aurora is estimated from official BLS state-level occupational wage data (2025), adjusted for regional cost-of-living differences using BEA RPP (Regional Price Parities).
2026 figures are projected from 2025 BLS data using a compound annual growth rate (CAGR) of 3.06%, derived from historical BLS wage trends for occupational therapists (SOC 29-1122).
Compiled and verified by Jordan Miller, OTR/L, a licensed occupational therapist with 10+ years of clinical experience. · View source data at BLS.gov