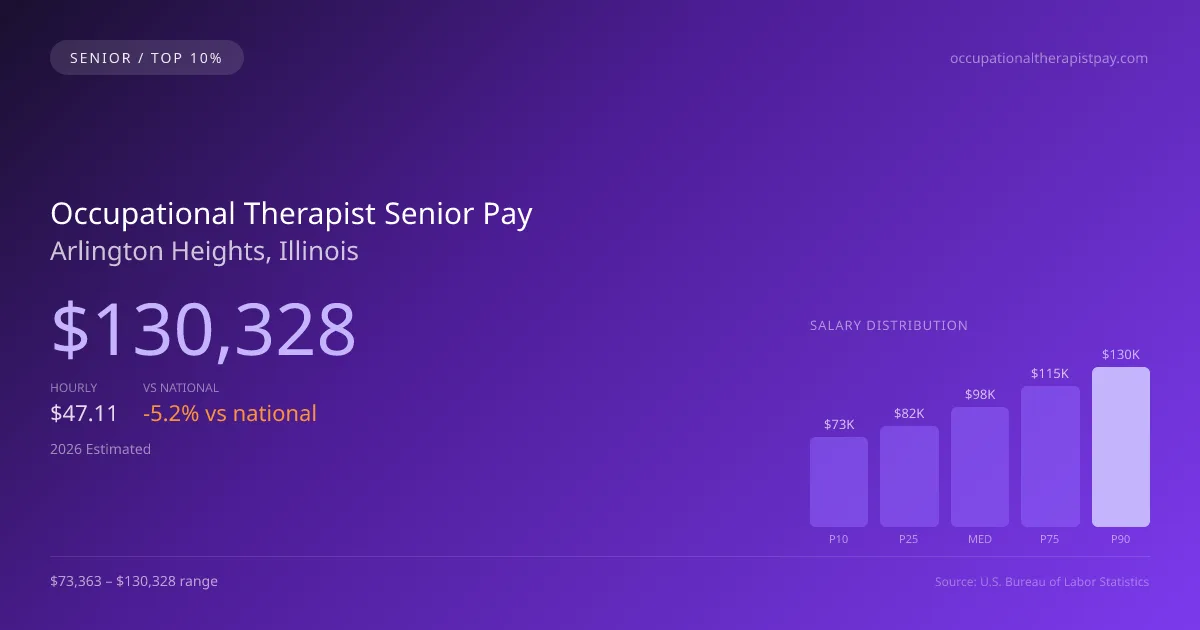
Senior Occupational Therapist Salary in Arlington Heights, IL: $130,328 (2026)
Quick Answer:The top tier of occupational therapists working in Arlington Heights, IL — those at or above the 90th percentile — pull in $130,328/year or more for 2026, based on BLS OEWS 2025 estimates for SOC 29-1122. Strip back Arlington Heights's price premium (BEA RPP 97.1, 3% below national) and that top-decile pay carries the same buying power as $134,220 in average-cost America. The 33% spread above city median typically rewards 7+ years of practice or specialty credentials.
Based on BLS state-level estimates · View source
Arlington Heights offers lucrative opportunities for experienced occupational therapists, with top earners projected to reach an annual salary of $130,328 by 2026. This figure places the highest-paid professionals in the area slightly below the national peak, highlighting a competitive market for senior-level practitioners. The difference between the median annual salary of $97,994 and the earnings of those at the 90th percentile shows a clear pathway for seasoned therapists to increase their compensation through advanced certifications and specialized roles. Achieving such top-tier pay in Arlington Heights often requires a commitment to continuous education and professional development, making it essential for candidates to engage in specialty training and obtain advanced credentials relevant to their field.
About the Arlington Heights Market
Salary estimated from Illinois average ($92,000) adjusted for local cost of living.
2026 Salary Percentile Distribution in Arlington Heights
Experienced occupational therapists at the top of the pay scale in Arlington Heights earn between $115,256 and $130,328 per year (2026 est.). This $56,965 range from 10th to 90th percentile reflects significant earnings potential growth over a career. The Arlington Heights median of $97,994 sits 5.23% below the US median.
Top OT, OTR Salary Comparison
| Level | Arlington Heights | National |
|---|---|---|
| Median (P50) | $97,994 | $103,400 |
| 75th Percentile | $115,256 | $120,240 |
| 90th Percentile (Top 10%) | $130,328 | $135,988 |
In Arlington Heights, experienced occupational therapists (P90) earn 33.00% more than the local median — reflecting the significant value of specialization and tenure in this market.
What Drives Top Occupational Therapist Pay in Arlington Heights
Advanced Certifications in Illinois
IL occupational therapists with additional specialty certifications within the occupational therapy field earn significantly above the $97,994 median. Expanded-scope credentials are increasingly valued by Arlington Heights employers.
Specialty Focus
Occupational Therapists focusing on high-acuity or specialty areas within the occupational therapy field in Arlington Heights command premium compensation, often reaching the $115,256–$130,328 range.
Large Health-System & Multi-Site Experience
Large hospital systems and multi-site employers in the Arlington Heights metro area often pay above-market rates for experienced occupational therapists who demonstrate efficiency and leadership.
Employer Loyalty & Patient Relationships
Long-tenured occupational therapists in Arlington Heights with established relationships have strong negotiating leverage. In this developing market, retention bonuses and annual raises are common for top performers.
Continuing Education & Leadership
Occupational Therapists in Illinois who pursue advanced degrees, mentor junior staff, or lead clinical education programs position themselves for the highest compensation tiers and management roles.
Occupational Therapist Career & Wage Growth Path in Arlington Heights
Clinical Occupational Therapist
0-5 yearsSenior/Lead Occupational Therapist
5-10 yearsOccupational Therapist Department Manager
10+ yearsEducator / Specialty Leadership
AdvancedArlington Heights ranks #11 of 65 Illinois cities for top earner occupational therapist salary (90th percentile: $130,328).
Top 10% occupational therapist compensation in Arlington Heights ($130,328) is 5.79% below the Illinois average P90 ($138,334).
2019 BLS Actual
$116,433
2025 BLS Actual
$126,458
2026 Current Est.
$130,328
2019–2027 Growth
+15.4%
Salary Trajectory for Occupational Therapists in Arlington Heights (2019–2027)
2019–2025: actual BLS OEWS data for this metro area. 2026+: CAGR 3.06% projection.
| Year | Annual Salary | Status |
|---|---|---|
| 2019 | $116,433 | Actual |
| 2020 | $117,564 | Actual |
| 2021 | $118,686 | Actual |
| 2022 | $118,714 | Actual |
| 2023 | $124,225 | Actual |
| 2024 | $117,364 | Actual |
| 2025 | $126,458 | Actual |
| 2026(current) | $130,328 | Estimated |
| 2027 | $134,316 | Projected |
Top-earning occupational therapists (90th percentile) in Arlington Heights saw their compensation grow 8.6% from $116,433 in 2019 to $126,458 in 2025, based on 7 years of BLS OEWS data for this metropolitan area. At a 3.06% annual growth rate, senior-level pay is projected to reach $134,316 by 2027, reflecting continued demand for clinical expertise and expanded-function credentials.
Note: Historical values (2019–2025) are actual BLS OEWS figures for the Arlington Heights metropolitan area, sourced from annual Occupational Employment and Wage Statistics surveys. 2026–2026 figures are current estimates, and 2027 values are projections, calculated using a 3.06% CAGR derived from 7-year BLS historical data. Actual salaries may vary based on employer, experience, certifications, and local market conditions.
Maximizing Your Occupational Therapist Earnings in Arlington Heights
Compensation for senior occupational therapists in Arlington Heights varies widely based on area specialization and employer type. Fields such as hand therapy, pediatrics, and neurorehabilitation can command higher salaries, particularly for those holding relevant board certifications like CHT or BCP. Employers in skilled nursing facilities and hospital settings typically offer higher compensation compared to school districts or outpatient clinics. As experienced professionals advance into leadership roles such as rehab directors or clinical specialty coordinators, they can expect not only salary increases but also additional benefits linked to their positions. Furthermore, obtaining a Master's (MOT) or Doctorate (OTD) from ACOTE-accredited programs and maintaining an active NBCOT certification will enhance earning potential in Illinois. The work environment also influences pay, with senior therapists in hospitals generally benefiting from higher salary brackets than those in educational settings, allowing for a broader range of opportunities in both professional development and income growth in the coming years.
More salary data for Arlington Heights, IL:
Frequently Asked Questions
How much do experienced occupational therapists make in Arlington Heights in 2026?
What drives higher occupational therapist pay in Arlington Heights?
What certifications boost occupational therapist salary in Arlington Heights?
Can experienced occupational therapists make six figures in Arlington Heights?
How much does occupational therapist salary increase over time in Arlington Heights?
Related Pages
Compare Salaries
Career Resources
Nearby Cities in Illinois
Written by Jordan Miller, OTR/L
Career Analyst
Jordan has 10 years of experience in occupational therapy. They specialize in pediatrics and work in a rehabilitation clinic.
Methodology & Data Source
Top-earner salary figures on this page are 2026 projections derived from the Bureau of Labor Statistics Occupational Employment and Wage Statistics (OEWS) survey, May 2026 release. BLS reported a 90th percentile salary of $126,458 for occupational therapists in the Arlington Heights metro area. A 3.06% compound annual growth rate (CAGR), calculated from 6-year national BLS wage trends, was applied to project current 2026 senior-level compensation. Individual earnings depend on certifications, specialization, practice type, and years of clinical experience.
Data Sources & Methodology
Salary data for Arlington Heights is estimated from official BLS state-level occupational wage data (2025), adjusted for regional cost-of-living differences using BEA RPP (Regional Price Parities).
2026 figures are projected from 2025 BLS data using a compound annual growth rate (CAGR) of 3.06%, derived from historical BLS wage trends for occupational therapists (SOC 29-1122).
Compiled and verified by Jordan Miller, OTR/L, a licensed occupational therapist with 10+ years of clinical experience. · View source data at BLS.gov