Occupational Therapist Salary in Kent, WA: $108,044 (2026)
Quick Answer:A full-time occupational therapist in Kent, WA earns a median $108,044/year (≈ $51.94/hour) in nominal terms for 2026 — projected from BLS OEWS 2025 (SOC 29-1122). Once you factor in Kent's price level (7% above national, BEA RPP 107.4), that paycheck buys what $100,600 would nationally. Nominal pay sits 0.2% below the Washington state average.
Based on BLS state-level estimates · View source
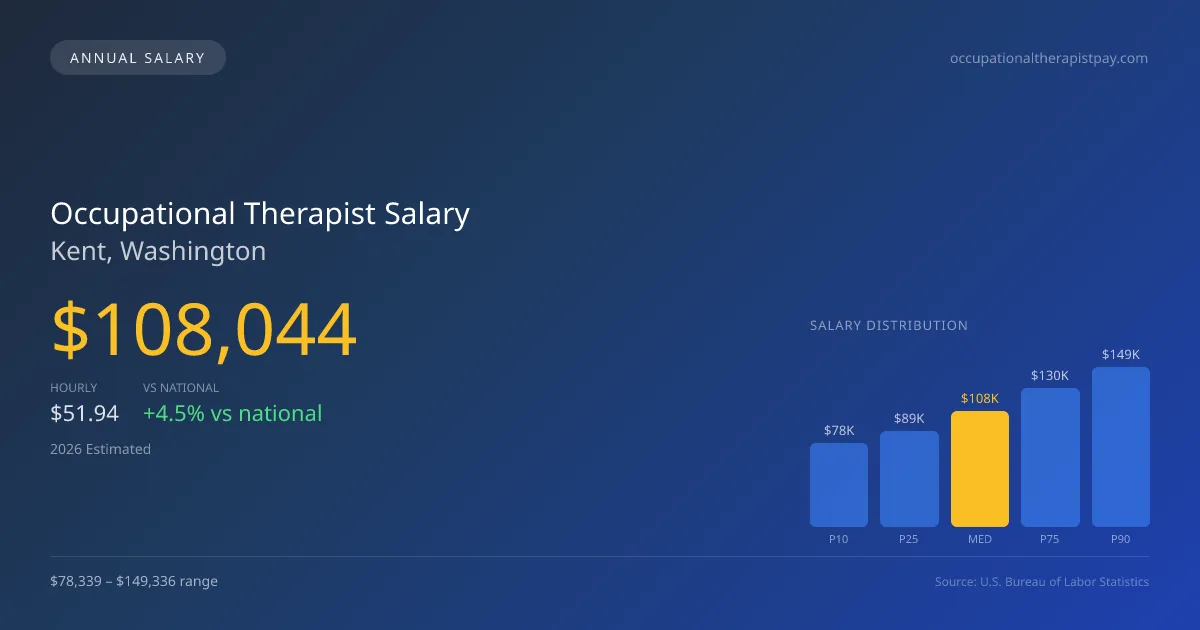
Occupational therapists in Kent, Washington are projected to earn a median annual salary of $108,044 in 2026, which represents a slight increase from the national median of $103,400. The occupational therapist salary in Kent reflects a range from $78,339 at the 10th percentile to $149,336 at the 90th percentile. Data sourced from estimates based on 2025 BLS data, adjusted for regional costs, show that Kent's earning potential is competitive. Factors influencing this range include various work environments such as hospitals, skilled nursing facilities (SNFs), and school settings, where pay dynamics vary considerably based on contractual agreements and service delivery models. With a robust local demand for rehabilitation professionals, those considering a career in this field should find promising opportunities ahead.
About the Kent Market
Salary estimated from Washington average ($98,000) adjusted for local cost of living.
Salary Breakdown
| Percentile | Annual | Hourly |
|---|---|---|
| Entry Level (P10) | $78,339 | $37.66 |
| Lower Range (P25) | $89,185 | $42.87 |
| Median (P50)(typical) | $108,044 | $51.94 |
| Upper Range (P75) | $129,986 | $62.50 |
| Top Earners (P90) | $149,336 | $71.79 |
Median Salary Position
4.49% above the national average
2026 Salary Percentile Distribution in Kent
In Kent, WA, the occupational therapist salary spread from the 10th to 90th percentile is $70,997 (2026 est.). At $108,044, the local median is 4.49% above the national median of $103,400.
Salary Calculator
At 40 hours/week in Kent: You'd be in the lower-middle range
How Kent Occupational Therapist Pay Compares
Kent median: $108,044/year (2026)
| Compared To | Median Salary | Kent Pays |
|---|---|---|
| Washington Average | $108,261 | -0.20% less |
| National Average | $103,400 | +4.49% more |
Occupational Therapists in Kent, WA earn a median of $108,044 per year (2026 est.), which is 4.49% higher than the national median of $103,400 and 0.20% below the Washington state average of $108,261.
Cost-of-Living Adjusted Salary
Kent has a cost of living 7.40% above the national average.
Adjusted salary = nominal × (100 / CoL index). CoL index: 100 = national average.
Kent, WA has a cost-of-living index of 107.4 (above the national average of 100). While the nominal salary of $108,044 is competitive, the higher cost of living reduces purchasing power to an effective $100,600 — a 6.89% reduction.
Compare Purchasing Power
Select a city to see how your salary compares after cost of living
Select a city above to compare purchasing power
2019 BLS Actual
$88,765
2025 BLS Actual
$104,836
2026 Current Est.
$108,044
2019–2027 Growth
+25.4%
Salary Trajectory for Occupational Therapists in Kent (2019–2027)
2019–2025: actual BLS OEWS data for this metro area. 2026+: CAGR 3.06% projection.
| Year | Annual Salary | Status |
|---|---|---|
| 2019 | $88,765 | Actual |
| 2020 | $90,155 | Actual |
| 2021 | $89,413 | Actual |
| 2022 | $97,365 | Actual |
| 2023 | $100,698 | Actual |
| 2024 | $105,067 | Actual |
| 2025 | $104,836 | Actual |
| 2026(current) | $108,044 | Estimated |
| 2027 | $111,350 | Projected |
Based on 7 years of BLS OEWS data for the Kent metropolitan area, the median occupational therapist salary grew 18.1% from $88,765 (2019) to $104,836 (2025). At a 3.06% compound annual growth rate, salaries are projected to reach $111,350 by 2027 — a total increase of $22,585 (25.44%) from 2019.
Note: Historical values (2019–2025) are actual BLS OEWS figures for the Kent metropolitan area, sourced from annual Occupational Employment and Wage Statistics surveys. 2026–2026 figures are current estimates, and 2027 values are projections, calculated using a 3.06% CAGR derived from 7-year BLS historical data. Actual salaries may vary based on employer, experience, certifications, and local market conditions.
Salary by Experience Level
| Experience | Estimated Salary Range |
|---|---|
| 0-2 years (New Graduate) | $78,339 – $89,185 |
| 3-5 years (Mid Career) | $89,185 – $108,044 |
| 5+ years (Experienced) | $108,044 – $129,986 |
| 10+ years (Top Earner) | $129,986 – $149,336 |
OT, OTR salary ranges estimated from BLS percentile data. Individual occupational therapist compensation varies by employer, certifications, and specialization.
Occupational Therapist Job Market in Kent
In Kent, a total of 33 occupational therapists are currently employed, indicative of a steady job market. However, the cost of living index at 107.4 suggests that the purchasing power may be slightly challenged, impacting overall financial comfort for local residents. Among area employers, hospitals generally offer the highest salaries for occupational therapists, followed by outpatient hand therapy clinics. Skilled nursing facilities and school district contracts tend to present the broadest salary range, influenced by factors such as Medicare reimbursement rates and certification stipends for specialties like Certified Hand Therapy (CHT). To maximize pay in Kent WA, therapists should consider seeking positions in hospitals or other high-demand settings, pursuing CHT certification, and being strategic regarding the type of contracts they accept, especially given the anticipated impact of Medicare adjustments on payment models.
More salary data for Kent, WA:
Frequently Asked Questions
How much do occupational therapists make in Kent, WA in 2026?
Is Kent, WA a good place to work as a occupational therapist?
Can occupational therapists make $100K in Kent?
What is the cost-of-living adjusted occupational therapist salary in Kent?
How much does a occupational therapist make per hour in Kent?
Related Pages
Compare Salaries
Career Resources
Nearby Cities in Washington
Written by Jordan Miller, OTR/L
Career Analyst
Jordan has 10 years of experience in occupational therapy. They specialize in pediatrics and work in a rehabilitation clinic.
Methodology & Data Source
Salary figures on this page are 2026 projections based on the Bureau of Labor Statistics Occupational Employment and Wage Statistics (OEWS) survey, May 2026 release. The BLS reported a median annual salary of $104,836 for occupational therapistsin the Kent metropolitan area. A 3.06% compound annual growth rate (CAGR), calculated from 6-year national BLS wage trends, was applied to project current 2026 compensation. Percentile ranges (P10–P90) represent the full salary distribution across experience levels and practice settings in this market.
Data Sources & Methodology
Salary data for Kent is estimated from official BLS state-level occupational wage data (2025), adjusted for regional cost-of-living differences using BEA RPP (Regional Price Parities).
2026 figures are projected from 2025 BLS data using a compound annual growth rate (CAGR) of 3.06%, derived from historical BLS wage trends for occupational therapists (SOC 29-1122).
Compiled and verified by Jordan Miller, OTR/L, a licensed occupational therapist with 10+ years of clinical experience. · View source data at BLS.gov