Occupational Therapist Salary in Kenmore, WA: $101,613 (2026)
Quick Answer:A full-time occupational therapist in Kenmore, WA earns a median $101,613/year (≈ $48.85/hour) in nominal terms for 2026 — projected from BLS OEWS 2025 (SOC 29-1122). Once you factor in Kenmore's price level (7% above national, BEA RPP 107.4), that paycheck buys what $94,612 would nationally. Nominal pay sits 6.1% below the Washington state average.
Based on BLS state-level estimates · View source
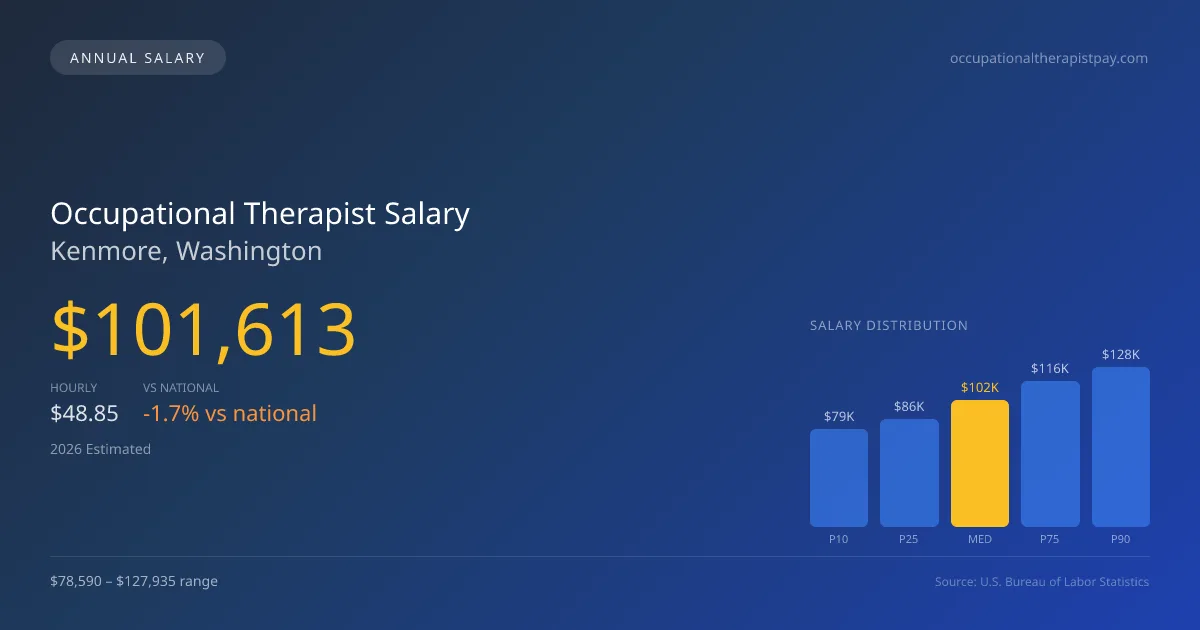
Occupational therapists in Kenmore, Washington, can anticipate an average annual salary of $101,613 in 2026, slightly lower than the national median of $103,400. The salaries range from approximately $78,590 at the lower end (P10) to around $127,935 at the high end (P90), indicating a diverse market for skilled professionals. These figures derive from 2025 BLS data, projected to 2026, and account for local cost adjustments, reflecting Kenmore's higher-than-average cost of living. Achieving specialty certification, such as the Certified Hand Therapist (CHT), can significantly enhance earning potential, adding value to a therapist's credentials in this competitive job market.
About the Kenmore Market
Salary estimated from Washington average ($98,000) adjusted for local cost of living.
Salary Breakdown
| Percentile | Annual | Hourly |
|---|---|---|
| Entry Level (P10) | $78,590 | $37.78 |
| Lower Range (P25) | $86,387 | $41.53 |
| Median (P50)(typical) | $101,613 | $48.85 |
| Upper Range (P75) | $116,430 | $55.97 |
| Top Earners (P90) | $127,935 | $61.51 |
Median Salary Position
1.73% below the national average
2026 Salary Percentile Distribution in Kenmore
In Kenmore, WA, the occupational therapist salary spread from the 10th to 90th percentile is $49,345 (2026 est.). At $101,613, the local median is 1.73% below the national median of $103,400.
Salary Calculator
At 40 hours/week in Kenmore: You'd be in the lower-middle range
How Kenmore Occupational Therapist Pay Compares
Kenmore median: $101,613/year (2026)
| Compared To | Median Salary | Kenmore Pays |
|---|---|---|
| Washington Average | $108,214 | -6.10% less |
| National Average | $103,400 | -1.73% less |
Occupational Therapists in Kenmore, WA earn a median of $101,613 per year (2026 est.), which is 1.73% lower than the national median of $103,400 and 6.10% below the Washington state average of $108,214.
Cost-of-Living Adjusted Salary
Kenmore has a cost of living 7.40% above the national average.
Adjusted salary = nominal × (100 / CoL index). CoL index: 100 = national average.
Kenmore, WA has a cost-of-living index of 107.4 (above the national average of 100). While the nominal salary of $101,613 is competitive, the higher cost of living reduces purchasing power to an effective $94,612 — a 6.89% reduction.
Compare Purchasing Power
Select a city to see how your salary compares after cost of living
Select a city above to compare purchasing power
2019 BLS Actual
$83,482
2025 BLS Actual
$98,596
2026 Current Est.
$101,613
2019–2027 Growth
+25.4%
Salary Trajectory for Occupational Therapists in Kenmore (2019–2027)
2019–2025: actual BLS OEWS data for this metro area. 2026+: CAGR 3.06% projection.
| Year | Annual Salary | Status |
|---|---|---|
| 2019 | $83,482 | Actual |
| 2020 | $84,789 | Actual |
| 2021 | $84,091 | Actual |
| 2022 | $91,570 | Actual |
| 2023 | $94,704 | Actual |
| 2024 | $98,814 | Actual |
| 2025 | $98,596 | Actual |
| 2026(current) | $101,613 | Estimated |
| 2027 | $104,722 | Projected |
Based on 7 years of BLS OEWS data for the Kenmore metropolitan area, the median occupational therapist salary grew 18.1% from $83,482 (2019) to $98,596 (2025). At a 3.06% compound annual growth rate, salaries are projected to reach $104,722 by 2027 — a total increase of $21,240 (25.44%) from 2019.
Note: Historical values (2019–2025) are actual BLS OEWS figures for the Kenmore metropolitan area, sourced from annual Occupational Employment and Wage Statistics surveys. 2026–2026 figures are current estimates, and 2027 values are projections, calculated using a 3.06% CAGR derived from 7-year BLS historical data. Actual salaries may vary based on employer, experience, certifications, and local market conditions.
Salary by Experience Level
| Experience | Estimated Salary Range |
|---|---|
| 0-2 years (New Graduate) | $78,590 – $86,387 |
| 3-5 years (Mid Career) | $86,387 – $101,613 |
| 5+ years (Experienced) | $101,613 – $116,430 |
| 10+ years (Top Earner) | $116,430 – $127,935 |
OT, OTR salary ranges estimated from BLS percentile data. Individual occupational therapist compensation varies by employer, certifications, and specialization.
Occupational Therapist Job Market in Kenmore
Despite the relatively modest number of occupational therapists employed in the area—only six—Kenmore presents opportunities primarily through skilled nursing facilities and outpatient clinics, which tend to offer the best compensation packages. The local cost of living index at 107.4 suggests that while salaries are competitive, they must also accommodate the increased cost of living, impacting purchasing power for professionals here. To maximize earnings, occupational therapists should consider targeting roles in higher-paying settings and explore opportunities related to the CHT credential, which commands a notable premium. Additionally, therapists might seek positions that provide benefits like year-round contracts or supportive work environments, as these can influence salary levels and overall job satisfaction in the occupational therapist pay landscape in Kenmore, WA.
More salary data for Kenmore, WA:
Frequently Asked Questions
How much do occupational therapists make in Kenmore, WA in 2026?
Is Kenmore, WA a good place to work as a occupational therapist?
Can occupational therapists make $100K in Kenmore?
What is the cost-of-living adjusted occupational therapist salary in Kenmore?
How much does a occupational therapist make per hour in Kenmore?
Related Pages
Compare Salaries
Career Resources
Nearby Cities in Washington
Written by Jordan Miller, OTR/L
Career Analyst
Jordan has 10 years of experience in occupational therapy. They specialize in pediatrics and work in a rehabilitation clinic.
Methodology & Data Source
Salary figures on this page are 2026 projections based on the Bureau of Labor Statistics Occupational Employment and Wage Statistics (OEWS) survey, May 2026 release. The BLS reported a median annual salary of $98,596 for occupational therapistsin the Kenmore metropolitan area. A 3.06% compound annual growth rate (CAGR), calculated from 6-year national BLS wage trends, was applied to project current 2026 compensation. Percentile ranges (P10–P90) represent the full salary distribution across experience levels and practice settings in this market.
Data Sources & Methodology
Salary data for Kenmore is estimated from official BLS state-level occupational wage data (2025), adjusted for regional cost-of-living differences using BEA RPP (Regional Price Parities).
2026 figures are projected from 2025 BLS data using a compound annual growth rate (CAGR) of 3.06%, derived from historical BLS wage trends for occupational therapists (SOC 29-1122).
Compiled and verified by Jordan Miller, OTR/L, a licensed occupational therapist with 10+ years of clinical experience. · View source data at BLS.gov