Occupational Therapist Salary in Danville, VA: $100,159 (2026)
Quick Answer:A full-time occupational therapist in Danville, VA earns a median $100,159/year (≈ $48.15/hour) in nominal terms for 2026 — projected from BLS OEWS 2025 (SOC 29-1122). Once you factor in Danville's price level (3% above national, BEA RPP 103.2), that paycheck buys what $97,053 would nationally. Nominal pay sits 2.2% below the Virginia state average.
Based on BLS state-level estimates · View source
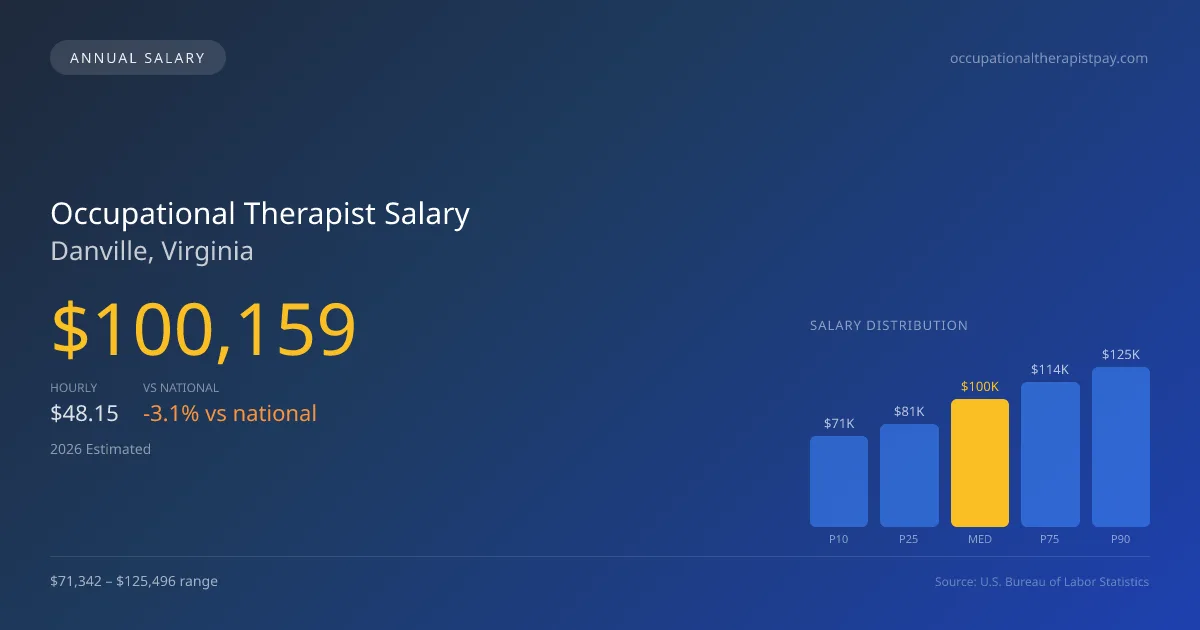
In 2026, the projected occupational therapist salary in Danville, VA, reaches $100,159, representing a slight decrease compared to the national median of $103,400. For those considering a career in this field, the full salary range is noteworthy, extending from $71,342 at the 10th percentile to $125,496 at the 90th percentile. These figures, derived from BLS state-level data and regional cost assessments, indicate a robust compensation opportunity in the local job market. Specialized credentials, such as the Certified Hand Therapist (CHT) designation, can lead to even higher earning potential, further enhancing occupational therapist pay in Danville, VA.
About the Danville Market
Salary estimated from Virginia average ($90,000) adjusted for local cost of living.
Salary Breakdown
| Percentile | Annual | Hourly |
|---|---|---|
| Entry Level (P10) | $71,342 | $34.30 |
| Lower Range (P25) | $81,070 | $38.98 |
| Median (P50)(typical) | $100,159 | $48.15 |
| Upper Range (P75) | $114,062 | $54.84 |
| Top Earners (P90) | $125,496 | $60.33 |
Median Salary Position
3.13% below the national average
2026 Salary Percentile Distribution in Danville
In Danville, VA, the occupational therapist salary spread from the 10th to 90th percentile is $54,154 (2026 est.). At $100,159, the local median is 3.13% below the national median of $103,400.
Salary Calculator
At 40 hours/week in Danville: You'd be above the median
How Danville Occupational Therapist Pay Compares
Danville median: $100,159/year (2026)
| Compared To | Median Salary | Danville Pays |
|---|---|---|
| Virginia Average | $102,412 | -2.20% less |
| National Average | $103,400 | -3.13% less |
Occupational Therapists in Danville, VA earn a median of $100,159 per year (2026 est.), which is 3.13% lower than the national median of $103,400 and 2.20% below the Virginia state average of $102,412.
Cost-of-Living Adjusted Salary
Danville has a cost of living 3.20% above the national average.
Adjusted salary = nominal × (100 / CoL index). CoL index: 100 = national average.
Danville, VA has a cost-of-living index of 103.2 (above the national average of 100). While the nominal salary of $100,159 is competitive, the higher cost of living reduces purchasing power to an effective $97,053 — a 3.1% reduction.
Compare Purchasing Power
Select a city to see how your salary compares after cost of living
Select a city above to compare purchasing power
2019 BLS Actual
$82,287
2025 BLS Actual
$97,185
2026 Current Est.
$100,159
2019–2027 Growth
+25.4%
Salary Trajectory for Occupational Therapists in Danville (2019–2027)
2019–2025: actual BLS OEWS data for this metro area. 2026+: CAGR 3.06% projection.
| Year | Annual Salary | Status |
|---|---|---|
| 2019 | $82,287 | Actual |
| 2020 | $83,575 | Actual |
| 2021 | $82,888 | Actual |
| 2022 | $90,259 | Actual |
| 2023 | $93,349 | Actual |
| 2024 | $90,811 | Actual |
| 2025 | $97,185 | Actual |
| 2026(current) | $100,159 | Estimated |
| 2027 | $103,224 | Projected |
Based on 7 years of BLS OEWS data for the Danville metropolitan area, the median occupational therapist salary grew 18.1% from $82,287 (2019) to $97,185 (2025). At a 3.06% compound annual growth rate, salaries are projected to reach $103,224 by 2027 — a total increase of $20,937 (25.44%) from 2019.
Note: Historical values (2019–2025) are actual BLS OEWS figures for the Danville metropolitan area, sourced from annual Occupational Employment and Wage Statistics surveys. 2026–2026 figures are current estimates, and 2027 values are projections, calculated using a 3.06% CAGR derived from 7-year BLS historical data. Actual salaries may vary based on employer, experience, certifications, and local market conditions.
Salary by Experience Level
| Experience | Estimated Salary Range |
|---|---|
| 0-2 years (New Graduate) | $71,342 – $81,070 |
| 3-5 years (Mid Career) | $81,070 – $100,159 |
| 5+ years (Experienced) | $100,159 – $114,062 |
| 10+ years (Top Earner) | $114,062 – $125,496 |
OT, OTR salary ranges estimated from BLS percentile data. Individual occupational therapist compensation varies by employer, certifications, and specialization.
Occupational Therapist Job Market in Danville
The job market for occupational therapists in Danville remains stable, with seven professionals currently employed in the area. The cost-of-living index in the region stands at 103.2, about 3.2% above the national average, which suggests that salaries must align with local living expenses to maintain purchasing power. Those working in hospital inpatient rehabilitation and skilled nursing facilities typically earn the highest wages, significantly influenced by the setting, productivity expectations, and employer contracts. Additionally, obtaining the CHT credential may lead to salary premiums, while flexibility in employment opportunities—such as year-round positions versus school contracts—can also affect compensation. To maximize pay in Danville, occupational therapists should consider seeking positions in higher-paying facilities, pursuing specialized certifications, and negotiating their contracts to reflect their skills and experience.
More salary data for Danville, VA:
Frequently Asked Questions
How much do occupational therapists make in Danville, VA in 2026?
Is Danville, VA a good place to work as a occupational therapist?
Can occupational therapists make $100K in Danville?
What is the cost-of-living adjusted occupational therapist salary in Danville?
How much does a occupational therapist make per hour in Danville?
Related Pages
Compare Salaries
Career Resources
Nearby Cities in Virginia
Written by Jordan Miller, OTR/L
Career Analyst
Jordan has 10 years of experience in occupational therapy. They specialize in pediatrics and work in a rehabilitation clinic.
Methodology & Data Source
Salary figures on this page are 2026 projections based on the Bureau of Labor Statistics Occupational Employment and Wage Statistics (OEWS) survey, May 2026 release. The BLS reported a median annual salary of $97,185 for occupational therapistsin the Danville metropolitan area. A 3.06% compound annual growth rate (CAGR), calculated from 6-year national BLS wage trends, was applied to project current 2026 compensation. Percentile ranges (P10–P90) represent the full salary distribution across experience levels and practice settings in this market.
Data Sources & Methodology
Salary data for Danville is estimated from official BLS state-level occupational wage data (2025), adjusted for regional cost-of-living differences using BEA RPP (Regional Price Parities).
2026 figures are projected from 2025 BLS data using a compound annual growth rate (CAGR) of 3.06%, derived from historical BLS wage trends for occupational therapists (SOC 29-1122).
Compiled and verified by Jordan Miller, OTR/L, a licensed occupational therapist with 10+ years of clinical experience. · View source data at BLS.gov