Occupational Therapist Salary in San Angelo, TX: $102,617 (2026)
Quick Answer:A full-time occupational therapist in San Angelo, TX earns a median $102,617/year (≈ $49.33/hour) in nominal terms for 2026 — projected from BLS OEWS 2025 (SOC 29-1122). Once you factor in San Angelo's price level (8% below national, BEA RPP 92.5), that paycheck buys what $110,994 would nationally. Nominal pay sits 2.7% below the Texas state average.
Official BLS data · View source
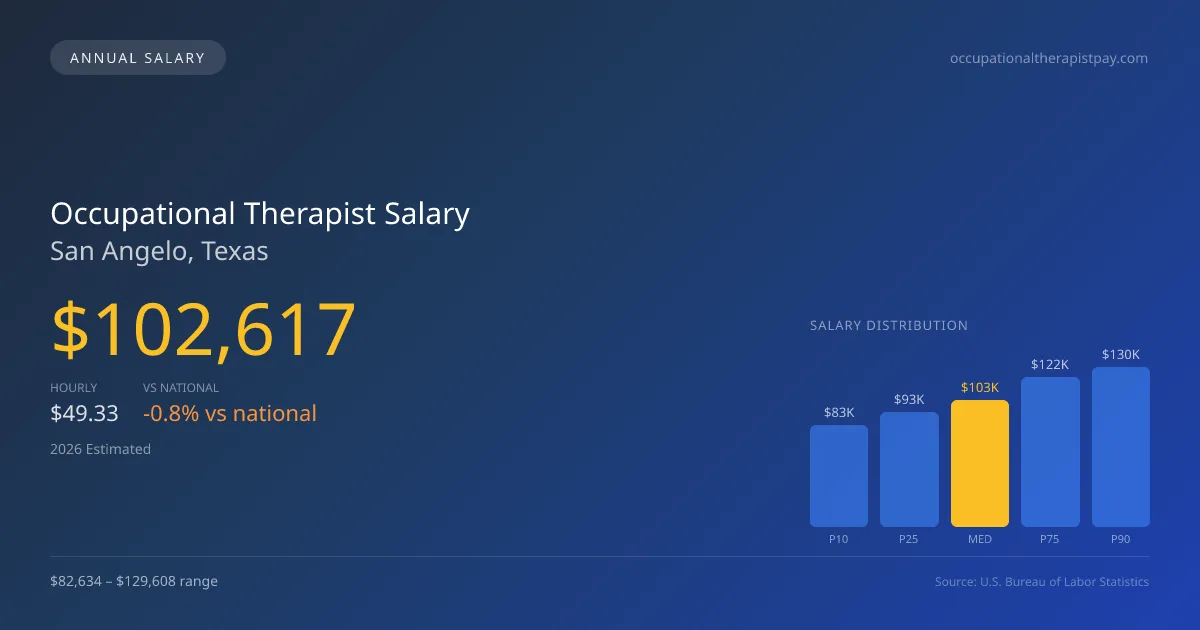
Occupational therapists in San Angelo, TX, can expect a median annual salary of $102,617 in 2026, which is slightly below the national median of $103,400. With a salary range from $82,634 at the 10th percentile to $129,608 at the 90th percentile, there is a substantial variation in earnings within this profession. This data, derived from official 2025 BLS OEWS surveys projected to 2026, reflects not only the local economic environment but also the increasing demand for specialized skills in occupational therapy. Achieving a Certified Hand Therapist (CHT) credential significantly enhances earning potential, reinforcing the value of advanced training and specialization in this field.
Salary Breakdown
| Percentile | Annual | Hourly |
|---|---|---|
| Entry Level (P10) | $82,634 | $39.73 |
| Lower Range (P25) | $93,259 | $44.83 |
| Median (P50)(typical) | $102,617 | $49.33 |
| Upper Range (P75) | $121,796 | $58.56 |
| Top Earners (P90) | $129,608 | $62.31 |
Median Salary Position
0.76% below the national average
2026 Salary Percentile Distribution in San Angelo
In San Angelo, TX, the occupational therapist salary spread from the 10th to 90th percentile is $46,974 (2026 est.). At $102,617, the local median is 0.76% below the national median of $103,400.
Salary Calculator
At 40 hours/week in San Angelo: You'd be in the lower-middle range
How San Angelo Occupational Therapist Pay Compares
San Angelo median: $102,617/year (2026)
| Compared To | Median Salary | San Angelo Pays |
|---|---|---|
| Texas Average | $105,464 | -2.70% less |
| National Average | $103,400 | -0.76% less |
Occupational Therapists in San Angelo, TX earn a median of $102,617 per year (2026 est.), which is 0.76% lower than the national median of $103,400 and 2.70% below the Texas state average of $105,464.
Cost-of-Living Adjusted Salary
San Angelo has a cost of living 7.55% below the national average, meaning your salary goes further here.
Adjusted salary = nominal × (100 / CoL index). CoL index: 100 = national average.
San Angelo, TX has a cost-of-living index of 92.453 (below the national average of 100). A occupational therapist earning $102,617 nominally has purchasing power equivalent to $110,994 in an average-cost city — an effective 8.16% boost.
Compare Purchasing Power
Select a city to see how your salary compares after cost of living
Select a city above to compare purchasing power
2019 BLS Actual
$79,870
2025 BLS Actual
$99,570
2026 Current Est.
$102,617
2019–2027 Growth
+32.4%
Salary Trajectory for Occupational Therapists in San Angelo (2019–2027)
2019–2025: actual BLS OEWS data for this metro area. 2026+: CAGR 3.06% projection.
| Year | Annual Salary | Status |
|---|---|---|
| 2019 | $79,870 | Actual |
| 2020 | $78,640 | Actual |
| 2021 | $90,320 | Actual |
| 2022 | $99,380 | Actual |
| 2023 | $100,650 | Actual |
| 2024 | $96,970 | Actual |
| 2025 | $99,570 | Actual |
| 2026(current) | $102,617 | Estimated |
| 2027 | $105,757 | Projected |
Based on 7 years of BLS OEWS data for the San Angelo metropolitan area, the median occupational therapist salary grew 24.7% from $79,870 (2019) to $99,570 (2025). At a 3.06% compound annual growth rate, salaries are projected to reach $105,757 by 2027 — a total increase of $25,887 (32.41%) from 2019.
Note: Historical values (2019–2025) are actual BLS OEWS figures for the San Angelo metropolitan area, sourced from annual Occupational Employment and Wage Statistics surveys. 2026–2026 figures are current estimates, and 2027 values are projections, calculated using a 3.06% CAGR derived from 7-year BLS historical data. Actual salaries may vary based on employer, experience, certifications, and local market conditions.
Salary by Experience Level
| Experience | Estimated Salary Range |
|---|---|
| 0-2 years (New Graduate) | $82,634 – $93,259 |
| 3-5 years (Mid Career) | $93,259 – $102,617 |
| 5+ years (Experienced) | $102,617 – $121,796 |
| 10+ years (Top Earner) | $121,796 – $129,608 |
OT, OTR salary ranges estimated from BLS percentile data. Individual occupational therapist compensation varies by employer, certifications, and specialization.
Occupational Therapist Job Market in San Angelo
The job market for occupational therapists in San Angelo is stable, with around 50 professionals employed in the area. The relatively low cost-of-living index of 92.453 suggests that the purchasing power of an occupational therapist salary in San Angelo is better than in many regions, allowing residents to enjoy a comfortable lifestyle. Employers such as skilled nursing facilities and hospital inpatient rehab centers tend to offer higher wages, although pay can vary considerably based on the work setting and certification level. Factors like the presence of CHT stipends, production expectations, and contracts with school districts further contribute to the wage discrepancy seen in this market. To maximize earnings, therapists may consider pursuing advanced certifications and seeking roles in settings where demand is higher, such as outpatient therapy clinics or specialized mental health facilities.
More salary data for San Angelo, TX:
Frequently Asked Questions
How much do occupational therapists make in San Angelo, TX in 2026?
Is San Angelo, TX a good place to work as a occupational therapist?
Can occupational therapists make $100K in San Angelo?
What is the cost-of-living adjusted occupational therapist salary in San Angelo?
How much does a occupational therapist make per hour in San Angelo?
Related Pages
Compare Salaries
Career Resources
Nearby Cities in Texas
Written by Jordan Miller, OTR/L
Career Analyst
Jordan has 10 years of experience in occupational therapy. They specialize in pediatrics and work in a rehabilitation clinic.
Methodology & Data Source
Salary figures on this page are 2026 projections based on the Bureau of Labor Statistics Occupational Employment and Wage Statistics (OEWS) survey, May 2026 release. The BLS reported a median annual salary of $99,570 for occupational therapistsin the San Angelo metropolitan area. A 3.06% compound annual growth rate (CAGR), calculated from 6-year national BLS wage trends, was applied to project current 2026 compensation. Percentile ranges (P10–P90) represent the full salary distribution across experience levels and practice settings in this market.
Data Sources & Methodology
Source: BLS, OEWS, 7-year dataset (–). Per-city data from annual BLS metropolitan area surveys.
2026 figures are projected from 2025 BLS data using a compound annual growth rate (CAGR) of 3.06%, derived from historical BLS wage trends for occupational therapists (SOC 29-1122).
Compiled and verified by Jordan Miller, OTR/L, a licensed occupational therapist with 10+ years of clinical experience. · View source data at BLS.gov