Occupational Therapist Salary in Conway, SC: $101,928 (2026)
Quick Answer:A full-time occupational therapist in Conway, SC earns a median $101,928/year (≈ $49.01/hour) in nominal terms for 2026 — projected from BLS OEWS 2025 (SOC 29-1122). Once you factor in Conway's price level (8% below national, BEA RPP 91.5), that paycheck buys what $111,397 would nationally. Nominal pay sits 2.6% below the South Carolina state average.
Based on BLS state-level estimates · View source
In Conway, South Carolina, the projected median annual salary for occupational therapists in 2026 is $101,928, which aligns closely with the national average of $103,400. This local salary estimate is derived from 2025 BLS data, adjusted for regional cost variations, reflecting a full salary range from $79,015 at the 10th percentile to $124,790 at the 90th percentile. The recent cuts in Medicare funding for skilled nursing facilities (SNFs) and outpatient therapy services have cast a shadow on compensation trends, adding pressure on salaries. Those struggling to negotiate higher wages amid these changes may find themselves facing a competitive local job market that currently employs only four occupational therapists.
About the Conway Market
Salary estimated from South Carolina average ($86,000) adjusted for local cost of living.
Salary Breakdown
| Percentile | Annual | Hourly |
|---|---|---|
| Entry Level (P10) | $79,015 | $37.99 |
| Lower Range (P25) | $86,787 | $41.73 |
| Median (P50)(typical) | $101,928 | $49.01 |
| Upper Range (P75) | $114,904 | $55.24 |
| Top Earners (P90) | $124,790 | $59.99 |
Median Salary Position
1.42% below the national average
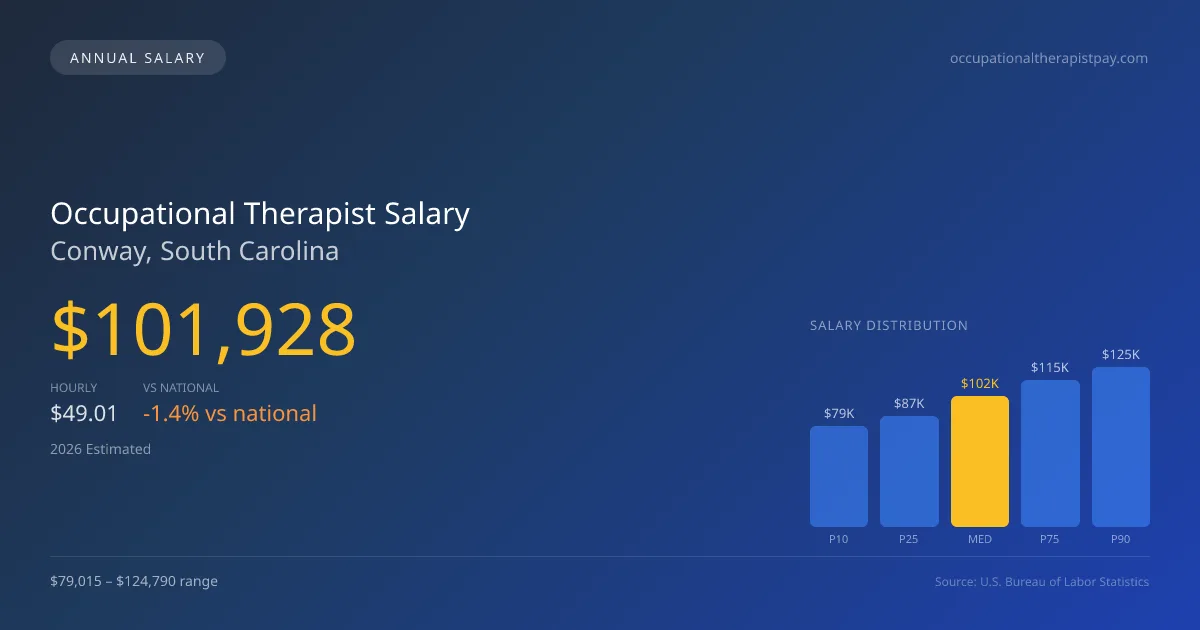
2026 Salary Percentile Distribution in Conway
In Conway, SC, the occupational therapist salary spread from the 10th to 90th percentile is $45,775 (2026 est.). At $101,928, the local median is 1.42% below the national median of $103,400.
Salary Calculator
At 40 hours/week in Conway: You'd be above the median
How Conway Occupational Therapist Pay Compares
Conway median: $101,928/year (2026)
| Compared To | Median Salary | Conway Pays |
|---|---|---|
| South Carolina Average | $104,649 | -2.60% less |
| National Average | $103,400 | -1.42% less |
Occupational Therapists in Conway, SC earn a median of $101,928 per year (2026 est.), which is 1.42% lower than the national median of $103,400 and 2.60% below the South Carolina state average of $104,649.
Cost-of-Living Adjusted Salary
Conway has a cost of living 8.50% below the national average, meaning your salary goes further here.
Adjusted salary = nominal × (100 / CoL index). CoL index: 100 = national average.
Conway, SC has a cost-of-living index of 91.5 (below the national average of 100). A occupational therapist earning $101,928 nominally has purchasing power equivalent to $111,397 in an average-cost city — an effective 9.29% boost.
Compare Purchasing Power
Select a city to see how your salary compares after cost of living
Select a city above to compare purchasing power
2019 BLS Actual
$83,741
2025 BLS Actual
$98,902
2026 Current Est.
$101,928
2019–2027 Growth
+25.4%
Salary Trajectory for Occupational Therapists in Conway (2019–2027)
2019–2025: actual BLS OEWS data for this metro area. 2026+: CAGR 3.06% projection.
| Year | Annual Salary | Status |
|---|---|---|
| 2019 | $83,741 | Actual |
| 2020 | $85,052 | Actual |
| 2021 | $84,352 | Actual |
| 2022 | $91,854 | Actual |
| 2023 | $94,998 | Actual |
| 2024 | $72,605 | Actual |
| 2025 | $98,902 | Actual |
| 2026(current) | $101,928 | Estimated |
| 2027 | $105,047 | Projected |
Based on 7 years of BLS OEWS data for the Conway metropolitan area, the median occupational therapist salary grew 18.1% from $83,741 (2019) to $98,902 (2025). At a 3.06% compound annual growth rate, salaries are projected to reach $105,047 by 2027 — a total increase of $21,306 (25.44%) from 2019.
Note: Historical values (2019–2025) are actual BLS OEWS figures for the Conway metropolitan area, sourced from annual Occupational Employment and Wage Statistics surveys. 2026–2026 figures are current estimates, and 2027 values are projections, calculated using a 3.06% CAGR derived from 7-year BLS historical data. Actual salaries may vary based on employer, experience, certifications, and local market conditions.
Salary by Experience Level
| Experience | Estimated Salary Range |
|---|---|
| 0-2 years (New Graduate) | $79,015 – $86,787 |
| 3-5 years (Mid Career) | $86,787 – $101,928 |
| 5+ years (Experienced) | $101,928 – $114,904 |
| 10+ years (Top Earner) | $114,904 – $124,790 |
OT, OTR salary ranges estimated from BLS percentile data. Individual occupational therapist compensation varies by employer, certifications, and specialization.
Occupational Therapist Job Market in Conway
Occupational therapist pay in Conway, SC, is impacted by the local cost of living index, which stands at 91.5—below the national average of 100. This lower cost of living can enhance purchasing power for therapists compared to other regions. Specifically, settings such as hospital inpatient rehab tend to pay more than roles in school districts or SNFs due to higher productivity expectations and specialized services. For therapists seeking to maximize their pay, pursuing board certification like the Certified Hand Therapist (CHT) can yield additional compensation. Strategies to improve earnings could include targeting outpatient clinics and early intervention programs, where pay can be more favorable, while also considering year-round contracts over school-year positions to maintain a steady income stream.
More salary data for Conway, SC:
Frequently Asked Questions
How much do occupational therapists make in Conway, SC in 2026?
Is Conway, SC a good place to work as a occupational therapist?
Can occupational therapists make $100K in Conway?
What is the cost-of-living adjusted occupational therapist salary in Conway?
How much does a occupational therapist make per hour in Conway?
Related Pages
Compare Salaries
Career Resources
Nearby Cities in South Carolina
Written by Jordan Miller, OTR/L
Career Analyst
Jordan has 10 years of experience in occupational therapy. They specialize in pediatrics and work in a rehabilitation clinic.
Methodology & Data Source
Salary figures on this page are 2026 projections based on the Bureau of Labor Statistics Occupational Employment and Wage Statistics (OEWS) survey, May 2026 release. The BLS reported a median annual salary of $98,902 for occupational therapistsin the Conway metropolitan area. A 3.06% compound annual growth rate (CAGR), calculated from 6-year national BLS wage trends, was applied to project current 2026 compensation. Percentile ranges (P10–P90) represent the full salary distribution across experience levels and practice settings in this market.
Data Sources & Methodology
Salary data for Conway is estimated from official BLS state-level occupational wage data (2025), adjusted for regional cost-of-living differences using BEA RPP (Regional Price Parities).
2026 figures are projected from 2025 BLS data using a compound annual growth rate (CAGR) of 3.06%, derived from historical BLS wage trends for occupational therapists (SOC 29-1122).
Compiled and verified by Jordan Miller, OTR/L, a licensed occupational therapist with 10+ years of clinical experience. · View source data at BLS.gov