Occupational Therapist Salary in Cranston, RI: $101,648 (2026)
Quick Answer:A full-time occupational therapist in Cranston, RI earns a median $101,648/year (≈ $48.87/hour) in nominal terms for 2026 — projected from BLS OEWS 2025 (SOC 29-1122). Once you factor in Cranston's price level (1% above national, BEA RPP 100.5), that paycheck buys what $101,142 would nationally. Nominal pay sits 2.2% below the Rhode Island state average.
Based on BLS state-level estimates · View source
Occupational therapists in Cranston, RI, will see a median salary of $101,648 in 2026, reflecting the impact of recent Medicare cuts on skilled nursing facilities and outpatient therapy compensation. The projected salary range spans from $75,124 at the lower decile to $137,416 at the higher decile. These figures, derived from 2025 BLS data and adjusted for regional cost considerations, mirror a nuanced local job market. As the landscape of healthcare continues to evolve, occupational therapy pay in Cranston is shaped by various factors, including the demand for services in different settings and the ongoing shifts in reimbursement models.
About the Cranston Market
Salary estimated from Rhode Island average ($92,000) adjusted for local cost of living.
Salary Breakdown
| Percentile | Annual | Hourly |
|---|---|---|
| Entry Level (P10) | $75,124 | $36.11 |
| Lower Range (P25) | $84,702 | $40.72 |
| Median (P50)(typical) | $101,648 | $48.87 |
| Upper Range (P75) | $121,204 | $58.27 |
| Top Earners (P90) | $137,416 | $66.06 |
Median Salary Position
1.69% below the national average
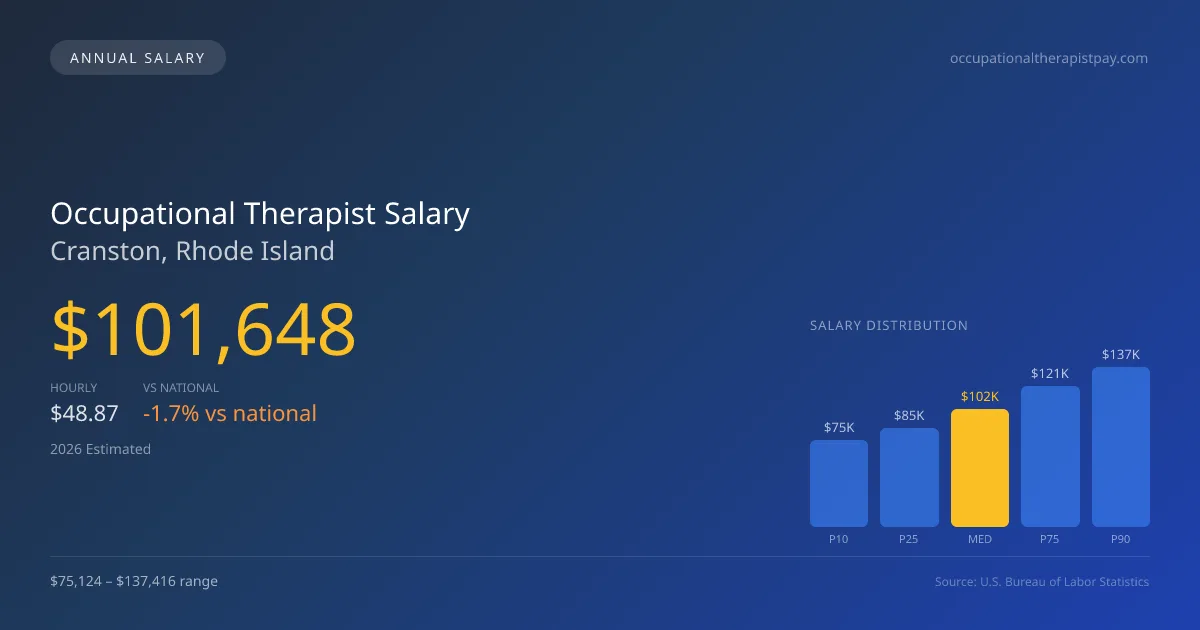
2026 Salary Percentile Distribution in Cranston
In Cranston, RI, the occupational therapist salary spread from the 10th to 90th percentile is $62,292 (2026 est.). At $101,648, the local median is 1.69% below the national median of $103,400.
Salary Calculator
At 40 hours/week in Cranston: You'd be in the lower-middle range
How Cranston Occupational Therapist Pay Compares
Cranston median: $101,648/year (2026)
| Compared To | Median Salary | Cranston Pays |
|---|---|---|
| Rhode Island Average | $103,935 | -2.20% less |
| National Average | $103,400 | -1.69% less |
Occupational Therapists in Cranston, RI earn a median of $101,648 per year (2026 est.), which is 1.69% lower than the national median of $103,400 and 2.20% below the Rhode Island state average of $103,935.
Cost-of-Living Adjusted Salary
Cranston has a cost of living 0.50% above the national average.
Adjusted salary = nominal × (100 / CoL index). CoL index: 100 = national average.
Cranston, RI has a cost-of-living index of 100.5 (above the national average of 100). While the nominal salary of $101,648 is competitive, the higher cost of living reduces purchasing power to an effective $101,142 — a 0.5% reduction.
Compare Purchasing Power
Select a city to see how your salary compares after cost of living
Select a city above to compare purchasing power
2019 BLS Actual
$83,511
2025 BLS Actual
$98,630
2026 Current Est.
$101,648
2019–2027 Growth
+25.4%
Salary Trajectory for Occupational Therapists in Cranston (2019–2027)
2019–2025: actual BLS OEWS data for this metro area. 2026+: CAGR 3.06% projection.
| Year | Annual Salary | Status |
|---|---|---|
| 2019 | $83,511 | Actual |
| 2020 | $84,818 | Actual |
| 2021 | $84,120 | Actual |
| 2022 | $91,601 | Actual |
| 2023 | $94,737 | Actual |
| 2024 | $90,441 | Actual |
| 2025 | $98,630 | Actual |
| 2026(current) | $101,648 | Estimated |
| 2027 | $104,759 | Projected |
Based on 7 years of BLS OEWS data for the Cranston metropolitan area, the median occupational therapist salary grew 18.1% from $83,511 (2019) to $98,630 (2025). At a 3.06% compound annual growth rate, salaries are projected to reach $104,759 by 2027 — a total increase of $21,248 (25.44%) from 2019.
Note: Historical values (2019–2025) are actual BLS OEWS figures for the Cranston metropolitan area, sourced from annual Occupational Employment and Wage Statistics surveys. 2026–2026 figures are current estimates, and 2027 values are projections, calculated using a 3.06% CAGR derived from 7-year BLS historical data. Actual salaries may vary based on employer, experience, certifications, and local market conditions.
Salary by Experience Level
| Experience | Estimated Salary Range |
|---|---|
| 0-2 years (New Graduate) | $75,124 – $84,702 |
| 3-5 years (Mid Career) | $84,702 – $101,648 |
| 5+ years (Experienced) | $101,648 – $121,204 |
| 10+ years (Top Earner) | $121,204 – $137,416 |
OT, OTR salary ranges estimated from BLS percentile data. Individual occupational therapist compensation varies by employer, certifications, and specialization.
Occupational Therapist Job Market in Cranston
Cranston currently employs 12 occupational therapists, which indicates a tight-knit professional community. With a cost-of-living index of 100.5, therapeutic professionals need to account for local expenses when evaluating their earning potential. In Cranston, settings such as hospitals generally offer higher compensation compared to skilled nursing facilities or school contracts, driven by the level of complexity involved in patient care. The disparity between the lower and higher ends of the salary spectrum can also be influenced by specialty certifications like the Certified Hand Therapist (CHT) designation, which commands a premium in pay. To maximize salaries in this market, occupational therapists should consider advancing their credentials and seeking employment in high-paying sectors while being mindful of the stricter productivity standards and reimbursement changes impacting outpatient services and rehabilitation settings.
More salary data for Cranston, RI:
Frequently Asked Questions
How much do occupational therapists make in Cranston, RI in 2026?
Is Cranston, RI a good place to work as a occupational therapist?
Can occupational therapists make $100K in Cranston?
What is the cost-of-living adjusted occupational therapist salary in Cranston?
How much does a occupational therapist make per hour in Cranston?
Related Pages
Compare Salaries
Career Resources
Nearby Cities in Rhode Island
Written by Jordan Miller, OTR/L
Career Analyst
Jordan has 10 years of experience in occupational therapy. They specialize in pediatrics and work in a rehabilitation clinic.
Methodology & Data Source
Salary figures on this page are 2026 projections based on the Bureau of Labor Statistics Occupational Employment and Wage Statistics (OEWS) survey, May 2026 release. The BLS reported a median annual salary of $98,630 for occupational therapistsin the Cranston metropolitan area. A 3.06% compound annual growth rate (CAGR), calculated from 6-year national BLS wage trends, was applied to project current 2026 compensation. Percentile ranges (P10–P90) represent the full salary distribution across experience levels and practice settings in this market.
Data Sources & Methodology
Salary data for Cranston is estimated from official BLS state-level occupational wage data (2025), adjusted for regional cost-of-living differences using BEA RPP (Regional Price Parities).
2026 figures are projected from 2025 BLS data using a compound annual growth rate (CAGR) of 3.06%, derived from historical BLS wage trends for occupational therapists (SOC 29-1122).
Compiled and verified by Jordan Miller, OTR/L, a licensed occupational therapist with 10+ years of clinical experience. · View source data at BLS.gov