Occupational Therapist Salary in Goldsboro, NC: $89,528 (2026)
Quick Answer:A full-time occupational therapist in Goldsboro, NC earns a median $89,528/year (≈ $43.05/hour) in nominal terms for 2026 — projected from BLS OEWS 2025 (SOC 29-1122). Once you factor in Goldsboro's price level (12% below national, BEA RPP 88.5), that paycheck buys what $101,205 would nationally. Nominal pay sits 0.5% above the North Carolina state average.
Official BLS data · View source
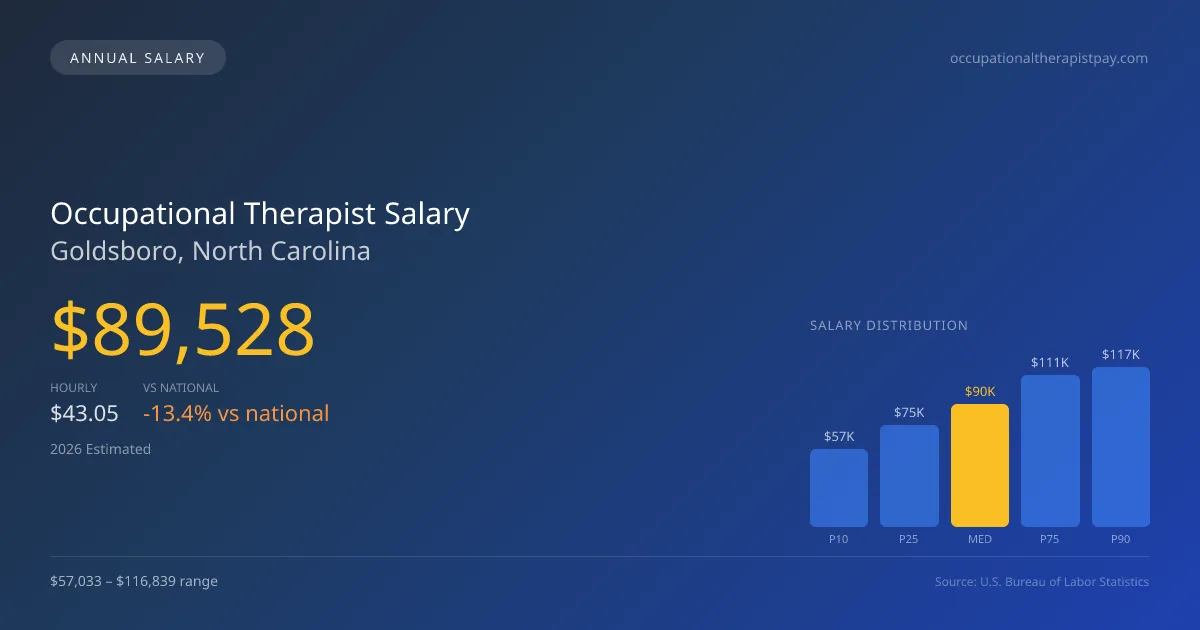
Occupational therapists in Goldsboro, North Carolina, earn a median annual salary of $89,528 in 2026, reflecting a notable decrease compared to the national average of $103,400. The salary range for this profession spans from $57,033 at the 10th percentile to $116,839 at the 90th percentile. This data is derived from official Bureau of Labor Statistics (BLS) OEWS surveys and projects the evolving landscape of occupational therapy salaries post-2022, particularly noting the impact of Medicare cuts on skilled nursing facilities (SNF) and outpatient therapy remuneration. The job market in Goldsboro provides a unique context for occupational therapy professionals, especially as demand persists despite economic headwinds.
Salary Breakdown
| Percentile | Annual | Hourly |
|---|---|---|
| Entry Level (P10) | $57,033 | $27.42 |
| Lower Range (P25) | $74,595 | $35.86 |
| Median (P50)(typical) | $89,528 | $43.05 |
| Upper Range (P75) | $111,253 | $53.49 |
| Top Earners (P90) | $116,839 | $56.18 |
Median Salary Position
13.42% below the national average
2026 Salary Percentile Distribution in Goldsboro
In Goldsboro, NC, the occupational therapist salary spread from the 10th to 90th percentile is $59,806 (2026 est.). At $89,528, the local median is 13.42% below the national median of $103,400.
Salary Calculator
At 40 hours/week in Goldsboro: You'd be above the median
How Goldsboro Occupational Therapist Pay Compares
Goldsboro median: $89,528/year (2026)
| Compared To | Median Salary | Goldsboro Pays |
|---|---|---|
| North Carolina Average | $89,083 | +0.50% more |
| National Average | $103,400 | -13.42% less |
Occupational Therapists in Goldsboro, NC earn a median of $89,528 per year (2026 est.), which is 13.42% lower than the national median of $103,400 and 0.50% above the North Carolina state average of $89,083.
Cost-of-Living Adjusted Salary
Goldsboro has a cost of living 11.54% below the national average, meaning your salary goes further here.
Adjusted salary = nominal × (100 / CoL index). CoL index: 100 = national average.
Goldsboro, NC has a cost-of-living index of 88.462 (below the national average of 100). A occupational therapist earning $89,528 nominally has purchasing power equivalent to $101,205 in an average-cost city — an effective 13.04% boost.
Compare Purchasing Power
Select a city to see how your salary compares after cost of living
Select a city above to compare purchasing power
2019 BLS Actual
$73,553
2025 BLS Actual
$86,870
2026 Current Est.
$89,528
2019–2027 Growth
+25.4%
Salary Trajectory for Occupational Therapists in Goldsboro (2019–2027)
2019–2025: actual BLS OEWS data for this metro area. 2026+: CAGR 3.06% projection.
| Year | Annual Salary | Status |
|---|---|---|
| 2019 | $73,553 | Actual |
| 2020 | $74,705 | Actual |
| 2021 | $74,090 | Actual |
| 2022 | $80,679 | Actual |
| 2023 | $83,441 | Actual |
| 2024 | $96,910 | Actual |
| 2025 | $86,870 | Actual |
| 2026(current) | $89,528 | Estimated |
| 2027 | $92,268 | Projected |
Based on 7 years of BLS OEWS data for the Goldsboro metropolitan area, the median occupational therapist salary grew 18.1% from $73,553 (2019) to $86,870 (2025). At a 3.06% compound annual growth rate, salaries are projected to reach $92,268 by 2027 — a total increase of $18,715 (25.44%) from 2019.
Note: Historical values (2019–2025) are actual BLS OEWS figures for the Goldsboro metropolitan area, sourced from annual Occupational Employment and Wage Statistics surveys. 2026–2026 figures are current estimates, and 2027 values are projections, calculated using a 3.06% CAGR derived from 7-year BLS historical data. Actual salaries may vary based on employer, experience, certifications, and local market conditions.
Salary by Experience Level
| Experience | Estimated Salary Range |
|---|---|
| 0-2 years (New Graduate) | $57,033 – $74,595 |
| 3-5 years (Mid Career) | $74,595 – $89,528 |
| 5+ years (Experienced) | $89,528 – $111,253 |
| 10+ years (Top Earner) | $111,253 – $116,839 |
OT, OTR salary ranges estimated from BLS percentile data. Individual occupational therapist compensation varies by employer, certifications, and specialization.
Occupational Therapist Job Market in Goldsboro
The occupational therapist job market in Goldsboro currently employs about 30 professionals, showcasing a steady local demand amid an overall positive growth rate of 3.06% annually. With a cost of living index of 88.462, the purchasing power of salaries in this area tends to stretch further compared to other regions. Facilities that typically offer higher wages include hospital inpatient rehab programs and outpatient clinics, focusing on hand therapy, as opposed to the more limited pay seen in school districts or SNF settings. Variability in occupational therapist pay is shaped by factors such as departmental productivity expectations, contract types (year-round versus school-year), and specialized credentials like the Certified Hand Therapist (CHT) designation, which commands a premium. To maximize earnings in Goldsboro, therapists should consider pursuing additional certifications and targeting specialized settings that compensate for their expertise.
More salary data for Goldsboro, NC:
Frequently Asked Questions
How much do occupational therapists make in Goldsboro, NC in 2026?
Is Goldsboro, NC a good place to work as a occupational therapist?
Can occupational therapists make $100K in Goldsboro?
What is the cost-of-living adjusted occupational therapist salary in Goldsboro?
How much does a occupational therapist make per hour in Goldsboro?
Related Pages
Compare Salaries
Career Resources
Nearby Cities in North Carolina
Written by Jordan Miller, OTR/L
Career Analyst
Jordan has 10 years of experience in occupational therapy. They specialize in pediatrics and work in a rehabilitation clinic.
Methodology & Data Source
Salary figures on this page are 2026 projections based on the Bureau of Labor Statistics Occupational Employment and Wage Statistics (OEWS) survey, May 2026 release. The BLS reported a median annual salary of $86,870 for occupational therapistsin the Goldsboro metropolitan area. A 3.06% compound annual growth rate (CAGR), calculated from 6-year national BLS wage trends, was applied to project current 2026 compensation. Percentile ranges (P10–P90) represent the full salary distribution across experience levels and practice settings in this market.
Data Sources & Methodology
Source: BLS, OEWS, 2-year dataset (–). Per-city data from annual BLS metropolitan area surveys.
2026 figures are projected from 2025 BLS data using a compound annual growth rate (CAGR) of 3.06%, derived from historical BLS wage trends for occupational therapists (SOC 29-1122).
Compiled and verified by Jordan Miller, OTR/L, a licensed occupational therapist with 10+ years of clinical experience. · View source data at BLS.gov