Occupational Therapist Salary in Fremont, NE: $91,806 (2026)
Quick Answer:A full-time occupational therapist in Fremont, NE earns a median $91,806/year (≈ $44.14/hour) in nominal terms for 2026 — projected from BLS OEWS 2025 (SOC 29-1122). Once you factor in Fremont's price level (8% below national, BEA RPP 91.5), that paycheck buys what $100,334 would nationally. Nominal pay sits 3.0% below the Nebraska state average.
Based on BLS state-level estimates · View source
Occupational therapists in Fremont, Nebraska, are projected to earn a median annual salary of $91,806 in 2026, reflecting a slight decrease in comparison to the national median of $103,400. The salary range for these professionals varies significantly, from $64,242 at the 10th percentile to as much as $119,561 at the 90th percentile. These figures are drawn from estimates based on 2025 BLS data and adjusted for regional cost considerations. With the impact of Medicare cuts on skilled nursing facilities and outpatient therapy compensation post-2022, the dynamics of occupational therapist pay in Fremont NE present both challenges and opportunities for practitioners as they navigate their career options in this evolving market.
About the Fremont Market
Salary estimated from Nebraska average ($84,000) adjusted for local cost of living.
Salary Breakdown
| Percentile | Annual | Hourly |
|---|---|---|
| Entry Level (P10) | $64,242 | $30.89 |
| Lower Range (P25) | $77,012 | $37.03 |
| Median (P50)(typical) | $91,806 | $44.14 |
| Upper Range (P75) | $107,032 | $51.46 |
| Top Earners (P90) | $119,561 | $57.48 |
Median Salary Position
11.21% below the national average
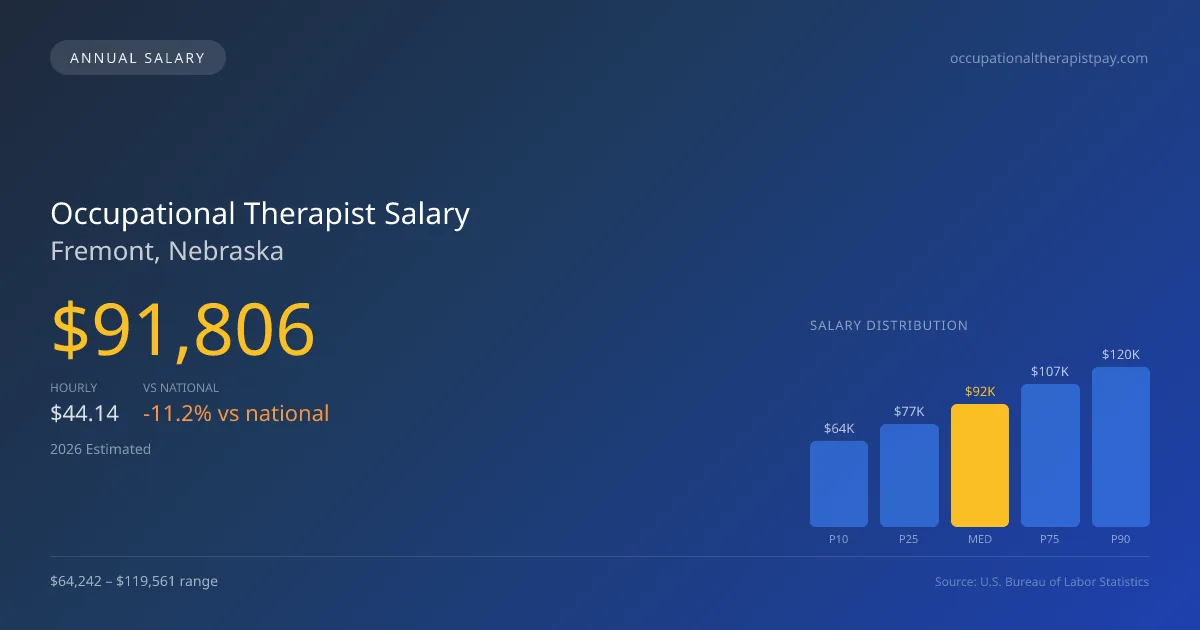
2026 Salary Percentile Distribution in Fremont
In Fremont, NE, the occupational therapist salary spread from the 10th to 90th percentile is $55,319 (2026 est.). At $91,806, the local median is 11.21% below the national median of $103,400.
Salary Calculator
At 40 hours/week in Fremont: You'd be above the median
How Fremont Occupational Therapist Pay Compares
Fremont median: $91,806/year (2026)
| Compared To | Median Salary | Fremont Pays |
|---|---|---|
| Nebraska Average | $94,645 | -3.00% less |
| National Average | $103,400 | -11.21% less |
Occupational Therapists in Fremont, NE earn a median of $91,806 per year (2026 est.), which is 11.21% lower than the national median of $103,400 and 3.00% below the Nebraska state average of $94,645.
Cost-of-Living Adjusted Salary
Fremont has a cost of living 8.50% below the national average, meaning your salary goes further here.
Adjusted salary = nominal × (100 / CoL index). CoL index: 100 = national average.
Fremont, NE has a cost-of-living index of 91.5 (below the national average of 100). A occupational therapist earning $91,806 nominally has purchasing power equivalent to $100,334 in an average-cost city — an effective 9.29% boost.
Compare Purchasing Power
Select a city to see how your salary compares after cost of living
Select a city above to compare purchasing power
2019 BLS Actual
$75,425
2025 BLS Actual
$89,080
2026 Current Est.
$91,806
2019–2027 Growth
+25.4%
Salary Trajectory for Occupational Therapists in Fremont (2019–2027)
2019–2025: actual BLS OEWS data for this metro area. 2026+: CAGR 3.06% projection.
| Year | Annual Salary | Status |
|---|---|---|
| 2019 | $75,425 | Actual |
| 2020 | $76,605 | Actual |
| 2021 | $75,975 | Actual |
| 2022 | $82,732 | Actual |
| 2023 | $85,564 | Actual |
| 2024 | $74,581 | Actual |
| 2025 | $89,080 | Actual |
| 2026(current) | $91,806 | Estimated |
| 2027 | $94,615 | Projected |
Based on 7 years of BLS OEWS data for the Fremont metropolitan area, the median occupational therapist salary grew 18.1% from $75,425 (2019) to $89,080 (2025). At a 3.06% compound annual growth rate, salaries are projected to reach $94,615 by 2027 — a total increase of $19,190 (25.44%) from 2019.
Note: Historical values (2019–2025) are actual BLS OEWS figures for the Fremont metropolitan area, sourced from annual Occupational Employment and Wage Statistics surveys. 2026–2026 figures are current estimates, and 2027 values are projections, calculated using a 3.06% CAGR derived from 7-year BLS historical data. Actual salaries may vary based on employer, experience, certifications, and local market conditions.
Salary by Experience Level
| Experience | Estimated Salary Range |
|---|---|
| 0-2 years (New Graduate) | $64,242 – $77,012 |
| 3-5 years (Mid Career) | $77,012 – $91,806 |
| 5+ years (Experienced) | $91,806 – $107,032 |
| 10+ years (Top Earner) | $107,032 – $119,561 |
OT, OTR salary ranges estimated from BLS percentile data. Individual occupational therapist compensation varies by employer, certifications, and specialization.
Occupational Therapist Job Market in Fremont
The job market for occupational therapists in Fremont is relatively small, with only four professionals reported in the area, indicating niche demand and limited competition. The cost of living index in Fremont stands at 91.5, suggesting a lower-than-average cost of living, which positively impacts the purchasing power of local therapists, even if the salaries are below the national average. Skilled nursing facilities and hospital inpatient rehab settings tend to offer higher compensation than outpatient clinics or school contracts. Factors contributing to the pay range include job setting, additional certifications like the Certified Hand Therapist (CHT), and productivity expectations. For occupational therapists in Fremont, strategies to maximize pay should include seeking positions in higher-paying environments, pursuing specialty certifications, and considering productivity bonuses or incentives that may offset the limitations imposed by regional salary averages.
More salary data for Fremont, NE:
Frequently Asked Questions
How much do occupational therapists make in Fremont, NE in 2026?
Is Fremont, NE a good place to work as a occupational therapist?
Can occupational therapists make $100K in Fremont?
What is the cost-of-living adjusted occupational therapist salary in Fremont?
How much does a occupational therapist make per hour in Fremont?
Related Pages
Compare Salaries
Career Resources
Nearby Cities in Nebraska
Written by Jordan Miller, OTR/L
Career Analyst
Jordan has 10 years of experience in occupational therapy. They specialize in pediatrics and work in a rehabilitation clinic.
Methodology & Data Source
Salary figures on this page are 2026 projections based on the Bureau of Labor Statistics Occupational Employment and Wage Statistics (OEWS) survey, May 2026 release. The BLS reported a median annual salary of $89,080 for occupational therapistsin the Fremont metropolitan area. A 3.06% compound annual growth rate (CAGR), calculated from 6-year national BLS wage trends, was applied to project current 2026 compensation. Percentile ranges (P10–P90) represent the full salary distribution across experience levels and practice settings in this market.
Data Sources & Methodology
Salary data for Fremont is estimated from official BLS state-level occupational wage data (2025), adjusted for regional cost-of-living differences using BEA RPP (Regional Price Parities).
2026 figures are projected from 2025 BLS data using a compound annual growth rate (CAGR) of 3.06%, derived from historical BLS wage trends for occupational therapists (SOC 29-1122).
Compiled and verified by Jordan Miller, OTR/L, a licensed occupational therapist with 10+ years of clinical experience. · View source data at BLS.gov