Occupational Therapist Salary in Evansville, IN: $92,599 (2026)
Quick Answer:A full-time occupational therapist in Evansville, IN earns a median $92,599/year (≈ $44.52/hour) in nominal terms for 2026 — projected from BLS OEWS 2025 (SOC 29-1122). Once you factor in Evansville's price level (8% below national, BEA RPP 91.5), that paycheck buys what $101,170 would nationally. Nominal pay sits 3.8% below the Indiana state average.
Official BLS data · View source
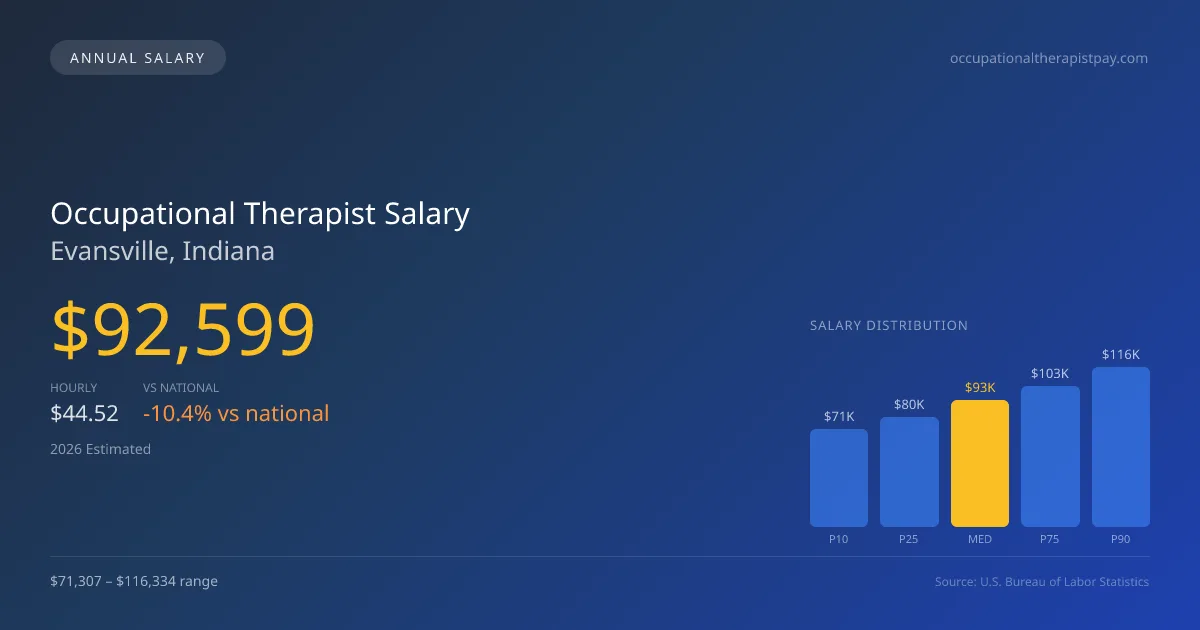
The projected median occupational therapist salary in Evansville, Indiana, for 2026 is $92,599, representing a notable reflection on the evolving healthcare landscape influenced by significant Medicare cuts impacting skilled nursing facilities and outpatient settings post-2022. Salaries in the region range from $71,307 at the 10th percentile to $116,334 at the 90th percentile, according to estimates based on 2025 BLS OEWS data, projected to 2026. While this figure positions Evansville approximately 10.45% lower than the national median of $103,400, local opportunities remain abundant. With 280 occupational therapists currently employed, the job market appears resilient, albeit competitive, which can affect salary negotiations and expectations across varying settings.
Salary Breakdown
| Percentile | Annual | Hourly |
|---|---|---|
| Entry Level (P10) | $71,307 | $34.28 |
| Lower Range (P25) | $80,170 | $38.54 |
| Median (P50)(typical) | $92,599 | $44.52 |
| Upper Range (P75) | $102,596 | $49.32 |
| Top Earners (P90) | $116,334 | $55.93 |
Median Salary Position
10.45% below the national average
2026 Salary Percentile Distribution in Evansville
In Evansville, IN, the occupational therapist salary spread from the 10th to 90th percentile is $45,027 (2026 est.). At $92,599, the local median is 10.45% below the national median of $103,400.
Salary Calculator
At 40 hours/week in Evansville: You'd be in the lower-middle range
How Evansville Occupational Therapist Pay Compares
Evansville median: $92,599/year (2026)
| Compared To | Median Salary | Evansville Pays |
|---|---|---|
| Indiana Average | $96,257 | -3.80% less |
| National Average | $103,400 | -10.45% less |
Occupational Therapists in Evansville, IN earn a median of $92,599 per year (2026 est.), which is 10.45% lower than the national median of $103,400 and 3.80% below the Indiana state average of $96,257.
Cost-of-Living Adjusted Salary
Evansville has a cost of living 8.47% below the national average, meaning your salary goes further here.
Adjusted salary = nominal × (100 / CoL index). CoL index: 100 = national average.
Evansville, IN has a cost-of-living index of 91.528 (below the national average of 100). A occupational therapist earning $92,599 nominally has purchasing power equivalent to $101,170 in an average-cost city — an effective 9.26% boost.
Compare Purchasing Power
Select a city to see how your salary compares after cost of living
Select a city above to compare purchasing power
2019 BLS Actual
$72,660
2025 BLS Actual
$89,850
2026 Current Est.
$92,599
2019–2027 Growth
+31.3%
Salary Trajectory for Occupational Therapists in Evansville (2019–2027)
2019–2025: actual BLS OEWS data for this metro area. 2026+: CAGR 3.06% projection.
| Year | Annual Salary | Status |
|---|---|---|
| 2019 | $72,660 | Actual |
| 2020 | $67,790 | Actual |
| 2021 | $77,630 | Actual |
| 2022 | $83,550 | Actual |
| 2023 | $89,060 | Actual |
| 2024 | $79,930 | Actual |
| 2025 | $89,850 | Actual |
| 2026(current) | $92,599 | Estimated |
| 2027 | $95,433 | Projected |
Based on 7 years of BLS OEWS data for the Evansville metropolitan area, the median occupational therapist salary grew 23.7% from $72,660 (2019) to $89,850 (2025). At a 3.06% compound annual growth rate, salaries are projected to reach $95,433 by 2027 — a total increase of $22,773 (31.34%) from 2019.
Note: Historical values (2019–2025) are actual BLS OEWS figures for the Evansville metropolitan area, sourced from annual Occupational Employment and Wage Statistics surveys. 2026–2026 figures are current estimates, and 2027 values are projections, calculated using a 3.06% CAGR derived from 7-year BLS historical data. Actual salaries may vary based on employer, experience, certifications, and local market conditions.
Salary by Experience Level
| Experience | Estimated Salary Range |
|---|---|
| 0-2 years (New Graduate) | $71,307 – $80,170 |
| 3-5 years (Mid Career) | $80,170 – $92,599 |
| 5+ years (Experienced) | $92,599 – $102,596 |
| 10+ years (Top Earner) | $102,596 – $116,334 |
OT, OTR salary ranges estimated from BLS percentile data. Individual occupational therapist compensation varies by employer, certifications, and specialization.
Occupational Therapist Job Market in Evansville
In Evansville, the cost of living index is below the national average at 91.528, which impacts the purchasing power of local salaries. Factors influencing compensation differ widely among employers, with skilled nursing facilities generally offering lower salaries compared to hospital inpatient rehab centers or specialized outpatient programs, particularly for those holding the Certified Hand Therapist (CHT) credential. The disparity in occupational therapist pay in Evansville, IN, is often driven by setting and responsibilities, where those in high-intensity environments like hospitals tend to earn more, while school district contracts and early intervention programs may present more stable but lower-paying options. To optimize pay, therapists should consider enhancing their qualifications, pursuing board certifications, and leveraging skills to meet productivity expectations within their specific roles in Evansville’s diverse healthcare landscape.
More salary data for Evansville, IN:
Frequently Asked Questions
How much do occupational therapists make in Evansville, IN in 2026?
Is Evansville, IN a good place to work as a occupational therapist?
Can occupational therapists make $100K in Evansville?
What is the cost-of-living adjusted occupational therapist salary in Evansville?
How much does a occupational therapist make per hour in Evansville?
Related Pages
Compare Salaries
Career Resources
Nearby Cities in Indiana
Written by Jordan Miller, OTR/L
Career Analyst
Jordan has 10 years of experience in occupational therapy. They specialize in pediatrics and work in a rehabilitation clinic.
Methodology & Data Source
Salary figures on this page are 2026 projections based on the Bureau of Labor Statistics Occupational Employment and Wage Statistics (OEWS) survey, May 2026 release. The BLS reported a median annual salary of $89,850 for occupational therapistsin the Evansville metropolitan area. A 3.06% compound annual growth rate (CAGR), calculated from 6-year national BLS wage trends, was applied to project current 2026 compensation. Percentile ranges (P10–P90) represent the full salary distribution across experience levels and practice settings in this market.
Data Sources & Methodology
Source: BLS, OEWS, 7-year dataset (–). Per-city data from annual BLS metropolitan area surveys.
2026 figures are projected from 2025 BLS data using a compound annual growth rate (CAGR) of 3.06%, derived from historical BLS wage trends for occupational therapists (SOC 29-1122).
Compiled and verified by Jordan Miller, OTR/L, a licensed occupational therapist with 10+ years of clinical experience. · View source data at BLS.gov