Occupational Therapist Salary in California: $128,258 (2026)
Quick Answer:Across California's 157 metropolitan areas, the average median occupational therapist pay sits at $128,258/year heading into 2026 — a figure projected from 2025 BLS OEWS wage data for SOC 29-1122. Because California sits at BEA RPP 113.1 (13% above the U.S. baseline), that statewide median translates to roughly $113,402 in nationally-comparable purchasing power. Highest-paying metros: Sunnyvale ($140,084), Oakland ($139,883), Santa Clara ($139,164).
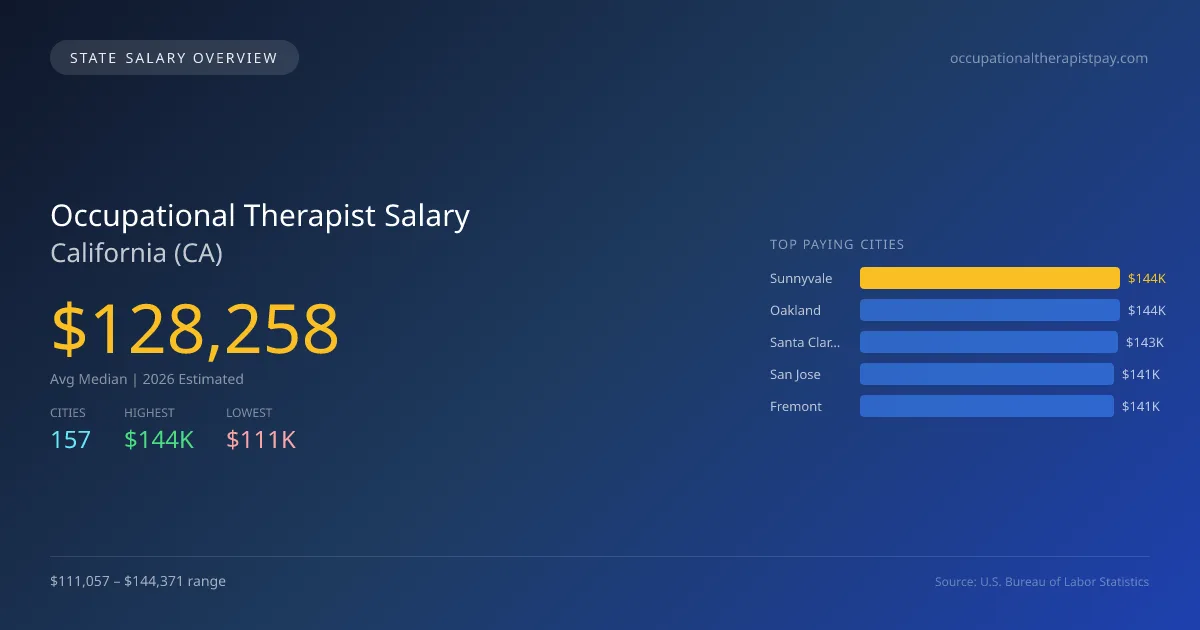
In California, occupational therapists can anticipate an average median salary of $128,258 in 2026, which significantly exceeds the national median of $103,400 by 24.0%. The disparity in pay between the highest and lowest paying cities is pronounced; for instance, Sunnyvale leads with a salary of $144,371, while Yuba City offers $111,057. This $33,314 difference is influenced by factors such as cost of living, demand for therapy services, and local healthcare funding levels. California’s employment landscape currently supports 16,189 occupational therapists, and the projected annual growth rate for this profession stands at 3.06%. Specific state requirements, including licensing and scope of practice laws, also impact salary potential and job availability. Strong demand for occupational therapy services is driven by an aging population, increased focus on rehabilitation, and expansive insurance coverage for therapy. Key metropolitan areas such as Oakland, Santa Clara, San Jose, and Fremont also present competitive salary numbers, with median salaries ranging from $140,983 to $144,163. As the need for skilled occupational therapists continues to grow in California, the job market reflects a stable outlook for this profession.
California Occupational Therapist Salary Range
Overall salary range in California: $62,001 (lowest entry-level) to $200,398 (highest top earner)
California vs National Average
California occupational therapists earn 24.04% more than the national median (+$24,858/year difference).
California Occupational Therapist Salary Distribution (2026)
Occupational Therapist salaries in California range from $90,554 (entry-level, 10th percentile) to $163,312 (top earners, 90th percentile), with a median of $128,258. The California median is $24,858 above the US national median of $103,400. The average hourly rate is $61.67/hr. Approximately 16,189 occupational therapists are employed across 157 cities.
2019 BLS Actual
$99,334
2025 BLS Actual
$124,450
2026 Current Est.
$128,258
2019–2027 Growth
+33.1%
Salary Trajectory for Occupational Therapists in California (2019–2027)
2019–2025: actual BLS OEWS data for this metro area. 2026+: CAGR 3.06% projection.
| Year | Annual Salary | Status |
|---|---|---|
| 2019 | $99,334 | Actual |
| 2020 | $103,658 | Actual |
| 2021 | $103,546 | Actual |
| 2022 | $107,095 | Actual |
| 2023 | $112,924 | Actual |
| 2024 | $119,756 | Actual |
| 2025 | $124,450 | Actual |
| 2026(current) | $128,258 | Estimated |
| 2027 | $132,183 | Projected |
Based on 7 years of BLS OEWS data for the California metropolitan area, the median occupational therapist salary grew 25.3% from $99,334 (2019) to $124,450 (2025). At a 3.06% compound annual growth rate, salaries are projected to reach $132,183 by 2027 — a total increase of $32,849 (33.07%) from 2019.
Note: Historical values (2019–2025) are actual BLS OEWS figures for the California metropolitan area, sourced from annual Occupational Employment and Wage Statistics surveys. 2026–2026 figures are current estimates, and 2027 values are projections, calculated using a 3.06% CAGR derived from 7-year BLS historical data. Actual salaries may vary based on employer, experience, certifications, and local market conditions.
Top 5 Highest Paying Cities in California
Lowest Paying Cities in California
| City | Median Salary |
|---|---|
| Yuba City | $111,057 |
| San Luis Obispo | $113,541 |
| Redding | $113,603 |
| Brea | $120,056 |
| Fresno | $120,261 |
Best Value Cities for Occupational Therapists in California
When adjusted for local cost of living, these California cities offer the most purchasing power for occupational therapists.
| City | Nominal Salary | CoL Index | Adjusted Salary |
|---|---|---|---|
| Chico | $133,215 | 101.197 | $131,639 |
| Vallejo | $139,131 | 108.479 | $128,256 |
| San Jose | $141,058 | 110.423 | $127,743 |
| Sunnyvale | $144,371 | 113.1 | $127,649 |
| Oakland | $144,163 | 113.1 | $127,465 |
Adjusted salary = nominal salary × (100 / CoL index). CoL index: 100 = national average. Lower index = lower cost of living.
Salary by Experience Level in California
| Experience Level | Estimated Annual |
|---|---|
| Entry Level (0-2 years) | $90,554 |
| Mid Career (3-7 years) | $128,258 |
| Experienced (7+ years) | $163,312 |
Estimates based on BLS percentile data averaged across California metro areas. Individual pay varies by employer, certifications, and specialization.
All 157 Cities in California
| # | City | Median Salary |
|---|---|---|
| 1 | Sunnyvale | $144,371 |
| 2 | Oakland | $144,163 |
| 3 | Santa Clara | $143,422 |
| 4 | San Jose | $141,058 |
| 5 | Fremont | $140,983 |
| 6 | San Francisco | $140,955 |
| 7 | Vallejo | $139,131 |
| 8 | Santa Cruz | $134,411 |
| 9 | Santa Ana | $134,071 |
| 10 | Chico | $133,215 |
| 11 | Santa Rosa | $131,927 |
| 12 | Fontana | $131,590 |
| 13 | Irvine | $131,445 |
| 14 | Pomona | $130,804 |
| 15 | Simi Valley | $130,732 |
| 16 | Escondido | $130,701 |
| 17 | Petaluma | $130,666 |
| 18 | Fairfield | $130,466 |
| 19 | Fullerton | $129,985 |
| 20 | Daly City | $129,873 |
| 21 | El Monte | $129,832 |
| 22 | Vista | $129,761 |
| 23 | Santa Maria | $129,742 |
| 24 | Concord | $129,730 |
| 25 | Clovis | $129,535 |
| 26 | Garden Grove | $129,402 |
| 27 | Temecula | $129,372 |
| 28 | Santa Clarita | $129,286 |
| 29 | Lancaster | $129,117 |
| 30 | Inglewood | $129,117 |
| 31 | Corona | $128,953 |
| 32 | Richmond | $128,932 |
| 33 | Rialto | $128,871 |
| 34 | Torrance | $128,708 |
| 35 | Elk Grove | $128,462 |
| 36 | Oceanside | $128,431 |
| 37 | Whittier | $128,393 |
| 38 | San Rafael | $128,384 |
| 39 | Napa | $128,299 |
| 40 | Rancho Cucamonga | $128,267 |
| 41 | Hayward | $128,196 |
| 42 | Woodland | $128,163 |
| 43 | Buena Park | $128,143 |
| 44 | Encinitas | $128,132 |
| 45 | Downey | $128,124 |
| 46 | Dublin | $128,053 |
| 47 | Anaheim | $128,013 |
| 48 | Redlands | $128,013 |
| 49 | Chino | $127,943 |
| 50 | Westminster | $127,903 |
| 51 | Santa Monica | $127,892 |
| 52 | San Mateo | $127,879 |
| 53 | Tulare | $127,842 |
| 54 | San Buenaventura | $127,797 |
| 55 | Mission Viejo | $127,712 |
| 56 | Moreno Valley | $127,711 |
| 57 | Pleasanton | $127,692 |
| 58 | Pasadena | $127,511 |
| 59 | Santee | $127,421 |
| 60 | Folsom | $127,392 |
| 61 | Glendale | $127,307 |
| 62 | Mountain View | $127,241 |
| 63 | Pittsburg | $127,231 |
| 64 | Novato | $127,190 |
| 65 | Costa Mesa | $127,143 |
| 66 | Berkeley | $127,010 |
| 67 | Huntington Beach | $126,979 |
| 68 | Bakersfield | $126,970 |
| 69 | Salinas | $126,949 |
| 70 | Jurupa Valley | $126,867 |
| 71 | Hemet | $126,830 |
| 72 | Union City | $126,820 |
| 73 | West Covina | $126,806 |
| 74 | Chino Hills | $126,770 |
| 75 | Stockton | $126,753 |
| 76 | Gilroy | $126,590 |
| 77 | Sacramento | $126,537 |
| 78 | San Marcos | $126,520 |
| 79 | Visalia | $126,444 |
| 80 | Tustin | $126,409 |
| 81 | San Ramon | $126,399 |
| 82 | Eastvale | $126,278 |
| 83 | Murrieta | $126,274 |
| 84 | Vacaville | $126,274 |
| 85 | Brentwood | $126,219 |
| 86 | Long Beach | $126,192 |
| 87 | Hesperia | $126,159 |
| 88 | Lake Elsinore | $126,149 |
| 89 | Roseville | $126,016 |
| 90 | Citrus Heights | $125,988 |
| 91 | El Cajon | $125,875 |
| 92 | San Clemente | $125,838 |
| 93 | Bellflower | $125,788 |
| 94 | Los Angeles | $125,774 |
| 95 | Palmdale | $125,732 |
| 96 | La Mirada | $125,731 |
| 97 | Apple Valley | $125,707 |
| 98 | Menifee | $125,670 |
| 99 | Yucaipa | $125,618 |
| 100 | Norwalk | $125,610 |
| 101 | Chula Vista | $125,549 |
| 102 | Rancho Cordova | $125,497 |
| 103 | San Diego | $125,403 |
| 104 | Montebello | $125,377 |
| 105 | Compton | $125,327 |
| 106 | Porterville | $125,236 |
| 107 | Lompoc | $125,220 |
| 108 | Hawthorne | $125,026 |
| 109 | Lodi | $125,005 |
| 110 | Antioch | $124,986 |
| 111 | Burbank | $124,976 |
| 112 | Ontario | $124,848 |
| 113 | Modesto | $124,816 |
| 114 | Alhambra | $124,685 |
| 115 | Livermore | $124,685 |
| 116 | Orange | $124,648 |
| 117 | South Gate | $124,645 |
| 118 | Victorville | $124,618 |
| 119 | West Sacramento | $124,575 |
| 120 | Poway | $124,543 |
| 121 | San Leandro | $124,375 |
| 122 | Carlsbad | $124,355 |
| 123 | Oxnard | $124,259 |
| 124 | Indio | $124,235 |
| 125 | Lake Forest | $124,235 |
| 126 | Carson | $124,014 |
| 127 | Rocklin | $123,994 |
| 128 | Newport Beach | $123,783 |
| 129 | Redwood City | $123,773 |
| 130 | Thousand Oaks | $123,758 |
| 131 | Turlock | $123,743 |
| 132 | Manteca | $123,703 |
| 133 | Perris | $123,694 |
| 134 | Madera | $123,593 |
| 135 | Baldwin Park | $123,372 |
| 136 | Palo Alto | $123,372 |
| 137 | San Bernardino | $123,340 |
| 138 | Lakewood | $123,323 |
| 139 | Riverside | $123,188 |
| 140 | Hanford | $123,072 |
| 141 | Beaumont | $122,962 |
| 142 | Tracy | $122,932 |
| 143 | Alameda | $122,892 |
| 144 | Laguna Niguel | $122,862 |
| 145 | Milpitas | $122,801 |
| 146 | Camarillo | $122,540 |
| 147 | Oakley | $122,491 |
| 148 | Davis | $122,461 |
| 149 | Upland | $122,370 |
| 150 | La Habra | $122,190 |
| 151 | Lynwood | $122,139 |
| 152 | Merced | $121,580 |
| 153 | Fresno | $120,261 |
| 154 | Brea | $120,056 |
| 155 | Redding | $113,603 |
| 156 | San Luis Obispo | $113,541 |
| 157 | Yuba City | $111,057 |
More California Salary Data
Hourly Rates
Explore occupational therapist hourly pay in California cities.
Senior / Experienced
Top earner salaries for experienced occupational therapists.
Compare Cities in California
View all comparisons →Explore More Occupational Therapist Salary Data
Frequently Asked Questions
How much do occupational therapists make in California in 2026?
What is the highest paying city for occupational therapists in California?
How does California occupational therapist pay compare to the national average?
What is the entry-level occupational therapist salary in California?
How many occupational therapists are employed in California?
Which California city offers the best value for occupational therapists?
Written by Jordan Miller, OTR/L
Career Analyst
Jordan has 10 years of experience in occupational therapy. They specialize in pediatrics and work in a rehabilitation clinic.
Methodology & Data Source
Statewide salary figures on this page are 2026 projections based on the Bureau of Labor Statistics Occupational Employment and Wage Statistics (OEWS) survey, May 2026 release. A 3.06% compound annual growth rate (CAGR), derived from 6-year national BLS wage trends, was applied to each metro area's reported salary to estimate current 2026 occupational therapist compensation across California. State averages are employment-weighted across 157 metro areas — larger metro areas with more occupational therapistscontribute proportionally more to the average, producing figures that better reflect typical compensation. Individual pay varies by city, employer, certifications, and experience.
Data Sources & Methodology
Source: BLS, OEWS, 7-year dataset (–). Per-city data from annual BLS metropolitan area surveys.
2026 figures are projected from 2025 BLS data using a compound annual growth rate (CAGR) of 3.06%, derived from historical BLS wage trends for occupational therapists (SOC 29-1122).
Compiled and verified by Jordan Miller, OTR/L, a licensed occupational therapist with 10+ years of clinical experience. · View source data at BLS.gov