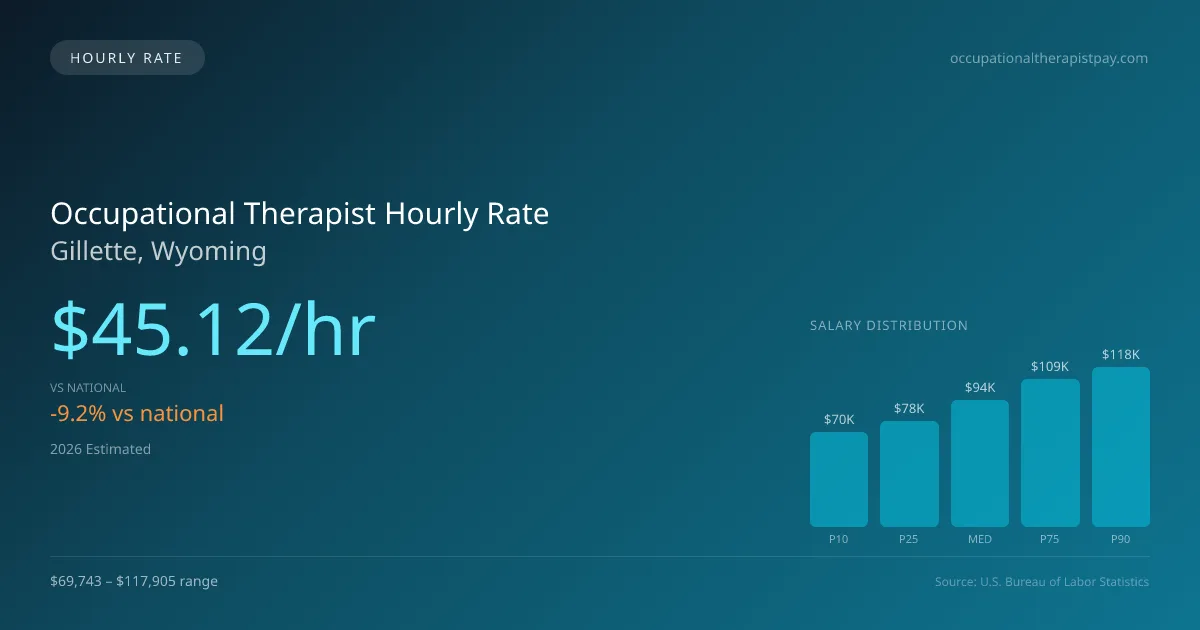
Occupational Therapist Hourly Pay in Gillette, WY: $45.12 (2026)
Quick Answer:Hourly pay for a occupational therapist working in Gillette, WY runs $45.12 at the median for 2026 — annualizing to $93,844 at a standard 2,080-hour year. Figures projected from BLS OEWS 2025 (SOC 29-1122). Weighted against Gillette's regional price level (BEA RPP 95.8, 4% below national), each hour of work buys what $47.10 nationally would. A 24-hour part-time schedule grosses $56,309 per year.
Based on BLS state-level estimates · View source
In Gillette, WY, the projected hourly pay for an occupational therapist stands at $45.12, which reflects a slightly lower compensation compared to the national average of $49.71. This hourly wage opens opportunities for both full-time and part-time roles in various settings, such as hospital rehab units, skilled nursing facilities, and outpatient clinics. For part-time occupational therapists working three days a week, this translates to significant annual earnings, especially in a community where the pay range stretches from $33.53 at the entry-level to $56.68 for more experienced professionals. Even for per-diem positions that are commonplace in this field, the estimates derived from annual salary data showcase the potential for flexible work arrangements that can suit various lifestyles.
About the Gillette Market
Salary estimated from Wyoming average ($88,000) adjusted for local cost of living.
Occupational Therapist Hourly Wage Breakdown
| Percentile | Hourly Rate | Per 8hr Shift |
|---|---|---|
| Entry Level (P10) | $33.53 | $268.20 |
| Lower Range (P25) | $37.54 | $300.36 |
| Median (P50) | $45.12 | $360.96 |
| Upper Range (P75) | $52.31 | $418.51 |
| Top Earners (P90) | $56.68 | $453.46 |
Estimated Annual Income by Work Schedule in Gillette
Based on $45.12/hr median hourly rate · 2026 est.
At $45.12/hr, a occupational therapist working full-time (40 hr/wk) in Gillette, WY can expect to earn approximately $93,849 per year (2026 est.). Part-time hygienists working 24 hours per week would earn around $54,144. With a cost-of-living index of 95.80 (below the national average), these earnings stretch further in Gillette.
Hourly Rate Calculator
Schedule Comparison in Gillette
| Schedule | Weekly | Monthly | Annual |
|---|---|---|---|
| Full-Time (40 hrs) | $1,804.79 | $7,821 | $93,849 |
| Part-Time (24 hrs) | $1,082.87 | $4,692 | $56,309 |
| Per Diem (16 hrs) | $721.91 | $3,128 | $37,540 |
Compare OT, OTR Wages With Similar Roles
| Role | Median Hourly |
|---|---|
| Occupational Therapist (Gillette) | $45.12 |
| Occupational Therapy Assistant (National Avg) | $33.15 |
| Physical Therapist (National Avg) | $48.65 |
| Speech-Language Pathologist (National Avg) | $43.80 |
| Recreational Therapist (National Avg) | $27.50 |
Occupational Therapists in Gillette, WY earn a median of $93,844 per year (2026 est.), which is 9.24% lower than the national median of $103,400 and 5.30% below the Wyoming state average of $99,096.
Occupational Therapist Hourly Pay vs. Cost of Living
Working 24h/week at $45.12/hr = $56,309/year (purchasing power: $58,778).
Working 40h/week (full-time) = $93,849/year (purchasing power: $97,963).
CoL index: 95.8 (100 = national average). Your dollars stretch further here.
2019 BLS Actual
$37.07/hr
2025 BLS Actual
$43.78/hr
2026 Current Est.
$45.12/hr
2019–2027 Growth
+25.4%
Hourly Rate Trajectory for Occupational Therapists in Gillette (2019–2027)
2019–2025: actual BLS OEWS data for this metro area. 2026+: CAGR 3.06% projection.
| Year | Hourly Rate | Status |
|---|---|---|
| 2019 | $37.07/hr | Actual |
| 2020 | $37.65/hr | Actual |
| 2021 | $37.34/hr | Actual |
| 2022 | $40.66/hr | Actual |
| 2023 | $42.05/hr | Actual |
| 2024 | $38.40/hr | Actual |
| 2025 | $43.78/hr | Actual |
| 2026(current) | $45.12/hr | Estimated |
| 2027 | $46.50/hr | Projected |
Based on 7 years of BLS OEWS metropolitan area data, the median hourly rate for occupational therapists in Gillette grew 18.1% from $37.07/hr (2019) to $43.78/hr (2025). At a 3.06% projected growth rate, hourly pay is expected to reach $46.50/hr by 2027. Part-time and per-diem occupational therapists can use this multi-year trend to benchmark future contract negotiations.
Note: Historical values (2019–2025) are actual BLS OEWS figures for the Gillette metropolitan area, sourced from annual Occupational Employment and Wage Statistics surveys. 2026–2026 figures are current estimates, and 2027 values are projections, calculated using a 3.06% CAGR derived from 7-year BLS historical data. Actual salaries may vary based on employer, experience, certifications, and local market conditions.
Working as an Hourly Occupational Therapist in Gillette
Focusing on the financial dynamics, part-time occupational therapists working 24 hours a week can expect to earn around $56,000 annually, a contrast to full-time peers who may bring home significantly more. Many per diem occupational therapists in Gillette command rates between $50 and $75 per hour, while specialized hand therapists with CHT credentials can achieve even higher rates, often ranging from $80 to $110 in cash-pay settings. Travel contracts may be enticing, with weekly pay between $1,800 and $2,800, appealing particularly to those willing to embrace flexibility. How occupational therapists navigate employer types in the area—such as skilled nursing facilities and mental health agencies—can greatly impact their hourly earnings. While some may settle for lower hourly pay to access essential benefits, others might prioritize higher hourly rates without health coverage. When negotiating, it’s advantageous for OTs to consider both their specific skills and the employment context, crafting a compensation package that aligns with their professional and personal priorities in Gillette.
More salary data for Gillette, WY:
Frequently Asked Questions
What is the hourly rate for occupational therapists in Gillette in 2026?
How much do part-time occupational therapists make in Gillette?
Are occupational therapists in Gillette paid hourly or salary?
How much does a full-time occupational therapist make per year in Gillette?
Do occupational therapists earn more per hour working part-time in Gillette?
Related Pages
Compare Salaries
Career Resources
Nearby Cities in Wyoming
Written by Jordan Miller, OTR/L
Career Analyst
Jordan has 10 years of experience in occupational therapy. They specialize in pediatrics and work in a rehabilitation clinic.
Methodology & Data Source
Hourly wage figures on this page are 2026 projections based on the Bureau of Labor Statistics Occupational Employment and Wage Statistics (OEWS) survey, May 2026 release. A 3.06% compound annual growth rate (CAGR), derived from 6-year national BLS wage trends, was applied to estimate current 2026 hourly rates for occupational therapists in Gillette. Part-time and full-time income estimates assume consistent weekly hours and do not account for overtime, benefits, or seasonal variation.
Data Sources & Methodology
Salary data for Gillette is estimated from official BLS state-level occupational wage data (2025), adjusted for regional cost-of-living differences using BEA RPP (Regional Price Parities).
2026 figures are projected from 2025 BLS data using a compound annual growth rate (CAGR) of 3.06%, derived from historical BLS wage trends for occupational therapists (SOC 29-1122).
Compiled and verified by Jordan Miller, OTR/L, a licensed occupational therapist with 10+ years of clinical experience. · View source data at BLS.gov